Stenotrophomonas sepilia is a non-fermenting, Gram-negative rod belonging to the family Lysobacteraceae, recently proposed as a novel species within the Stenotrophomonas maltophilia complex. It has been isolated from clinical specimens, particularly the respiratory tracts of people with cystic fibrosis, and may be misidentified as S. maltophilia by routine diagnostic methods. S. sepilia is delineated by whole-genome average nucleotide identity and carries intrinsic resistance determinants, including L1 and L2 beta-lactamases, similar to other members of the complex.
For detailed methods on how these thresholds were calculated, please see Methods. The suggested thresholds are in the table below. These thresholds are based on 0 genomes from RefSeq and 137 genomes from other sources. These thresholds were applied to all the bacteria dataset, which resulted in removing 10 and retaining 127. The list of genomes retained (i.e. high quality) and the list of genomes rejected (filtered) can be downloaded below. These files are in .xz format. The rejected genomes file also includes the reason why.
These tables provide a summary of the distribution of each metric, including SDeviation, Mean, Median, and Percentiles.
These thresholds were applied to all the bacteria dataset. The list of genomes retained (i.e. high quality) and the list of genomes rejected (filtered) can be downloaded below. These files are in .xz format. The rejected genomes file also includes the reason why.
| Metric | Lower bound | Upper bound |
|---|---|---|
| N50 | 45,000 | - |
| no_of_contigs | - | 200.0 |
| GC_Content | 66.00 | 67.00 |
| Completeness | 100.0 | - |
| Contamination | - | 2.000 |
| Total_Coding_Sequences | 3,800 | 4,400 |
| Genome_Size | 4,200,000 | 4,800,000 |
This plot shows the relationship between the number of coding sequences (CDS) and genome size. It helps to visualize how genome size correlates with the number of genes. This should be linear – as genome size increases, the number of coding sequences should also increase. Any secondary trend lines or non-linear behaviour indicates bona fide separate populations within the retained genomes or some remaining contaminant.
A table of complete RefSeq genomes for Stenotrophomonas sepilia used to calibrate this scheme. The file includes accessions, some sample information, genome size, GC content, and other key metrics.
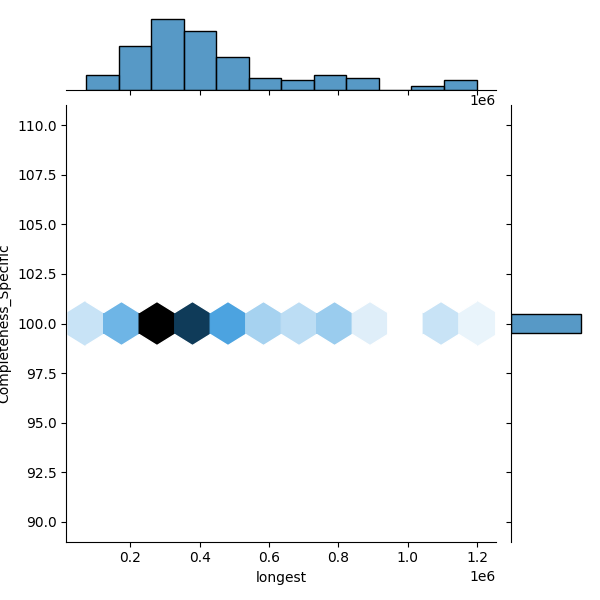
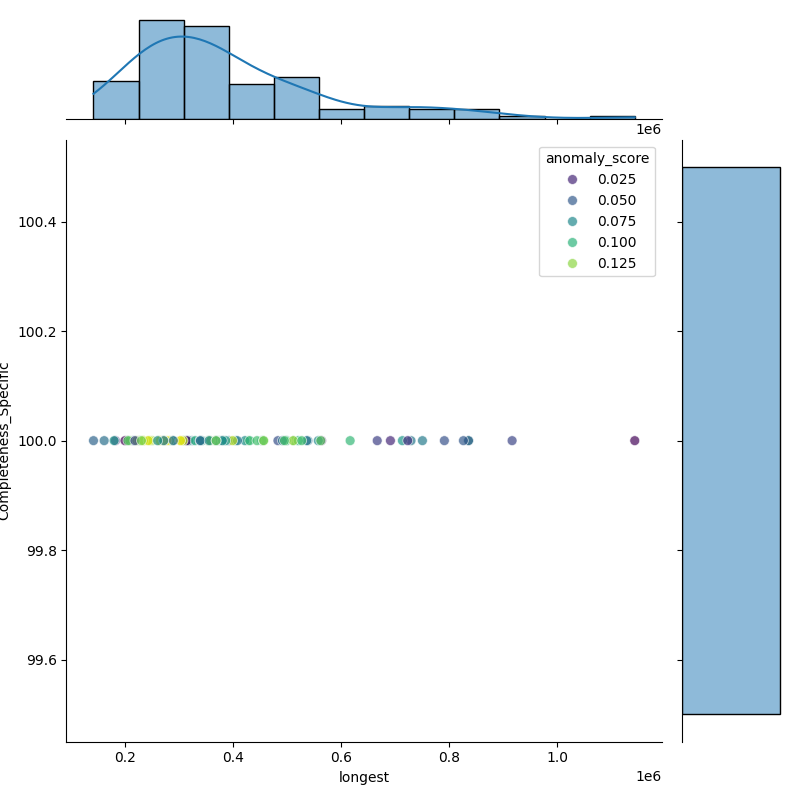
These plots show genomes before and after filtering to highlight the outliers removed. Left: Heatmap of all genomes in the dataset. Middle: A representative sample of genomes, with anomalies highlighted (purple). Right: The filtered distribution after applying filtering. There may have been additional adjustments and rounding so the distribution here may not enirely match with the final suggested metrics.