Staphylococcus aureus is a coagulase-positive, Gram-positive coccus of the family Staphylococcaceae, commonly carried on the skin and in the nares of healthy individuals. It is one of the most clinically significant bacterial pathogens, causing a wide spectrum of diseases from skin infections and food poisoning to endocarditis, osteomyelitis, and sepsis, with methicillin-resistant strains (MRSA) posing a major public-health threat. Genomically, S. aureus features a highly conserved core genome alongside a rich mobile genetic element repertoire encoding toxins, immune evasion factors, and antimicrobial resistance determinants.
Derived from 112,764 genomes: 1,860 from RefSeq and 110,904 from other sources. For the derivation pipeline and the PASS / WARN / FAIL verdict model, see the methods page for qualibact-v1.0.
Applied to the full All-The-Bacteria dataset, these thresholds place 107,176 genomes at PASS, 9,002 at WARN, and 4,938 at FAIL (121,116 assessed in total). The per-tier genome lists can be downloaded below in .csv.gz format; the FAIL list also records the reason each assembly was rejected.
This table summarises the distribution of each metric, including standard deviation, mean, median, and percentiles.
A combined summary table across all species is available on the summary page.
| Metric | Distribution | n | Mean | SD | Min | Q1 | Median | Q3 | Max |
|---|---|---|---|---|---|---|---|---|---|
| N50 | non-normal | 110,904 | 213,730 | 140,336 | 15,859 | 125,389 | 166,393 | 275,684 | 965,565 |
| no_of_contigs | non-normal | 110,904 | 68.49 | 36.84 | 14 | 45 | 60 | 80 | 359 |
| longest | non-normal | 110,904 | 465,348 | 226,270 | 47,070 | 300,824 | 415,530 | 590,002 | 1,409,092 |
| GC_Content | non-normal | 110,904 | 32.72 | 0.06 | 32.48 | 32.68 | 32.71 | 32.75 | 33.17 |
| Completeness_Specific | non-normal | 110,904 | 100 | 0 | 99.27 | 100 | 100 | 100 | 100 |
| Contamination | non-normal | 110,904 | 0.2 | 0.17 | 0 | 0.09 | 0.13 | 0.25 | 1.66 |
| Total_Coding_Sequences | non-normal | 110,904 | 2,625 | 89.87 | 2,387 | 2,561 | 2,619 | 2,685 | 3,072 |
| Genome_Size | non-normal | 110,904 | 2,799,910 | 65,233 | 2,573,304 | 2,753,794 | 2,796,516 | 2,842,763 | 3,112,305 |
Full statistics including KS test vs RefSeq and Wasserstein distance are in the downloadable summary.csv.
Derived from 112,764 genomes including 1,860 RefSeq references
Both Fail and Warn bands shown as the published rounded values — easier to cite and consistent across the species page, CSV downloads, and downstream QC tools.
| Metric | Fail below | Warn below | Warn above | Fail above |
|---|---|---|---|---|
| Genome_Size | 2,600,000 | 2,600,000 | 3,000,000 | 3,300,000 |
| GC_Content | 32.5 | 32.6 | 32.9 | 33.1 |
| Total_Coding_Sequences | 2,400 | 2,400 | 2,900 | 3,400 |
| Completeness_Specific | 95 | 100 | - | - |
| Contamination | - | - | 1 | 4 |
| N50 | 28,000 | 45,000 | - | - |
| no_of_contigs | - | - | 170 | 260 |
| longest | - | - | - | - |
How to read this: a value between the two warn columns is typical for this species and passes QC. A value between a warn column and the corresponding fail column is borderline — worth a manual look but not an outright failure. A value outside the fail columns is unusual enough to fail QC.
The published rounded thresholds (the values in the table above) were applied to the full AllTheBacteria-2024-08 set for this species. Each row carries the per-metric verdict and, where applicable, the reason a genome was demoted to WARN or FAIL. Files are gzipped CSV.
This plot shows the relationship between the number of coding sequences (CDS) and genome size — how the number of genes scales with assembly length. The relationship should be roughly linear: as genome size increases, the number of coding sequences should rise proportionally. A secondary trend line or non-linear behaviour can indicate either bona fide sub-populations within the retained genomes (e.g. distinct sub-clades) or residual contamination that survived filtering.
Histogram comparing SRA to RefSeq; each bar shows genome density across value ranges to highlight shifts, peaks, or outliers.
QQ (quantile-quantile) plot comparing SRA and RefSeq. Points along the diagonal follow the expected distribution; deviations indicate skew, outliers, or other systematic differences.
A table of complete RefSeq genomes for Staphylococcus aureus used to calibrate this scheme. The file includes accessions, some sample information, genome size, GC content, and other key metrics.
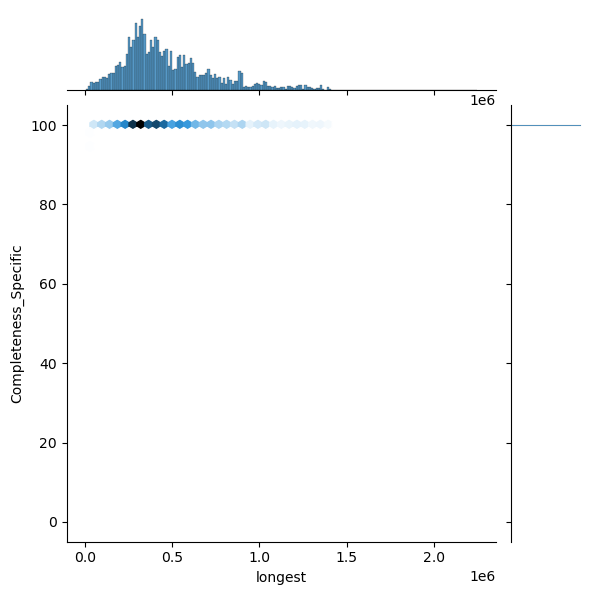
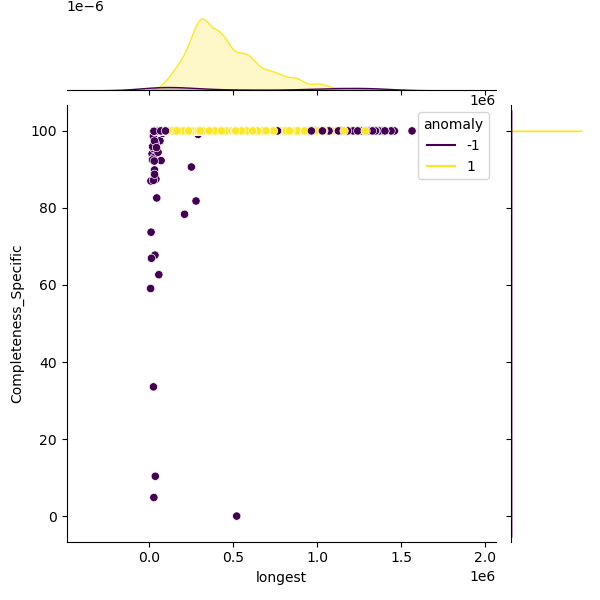
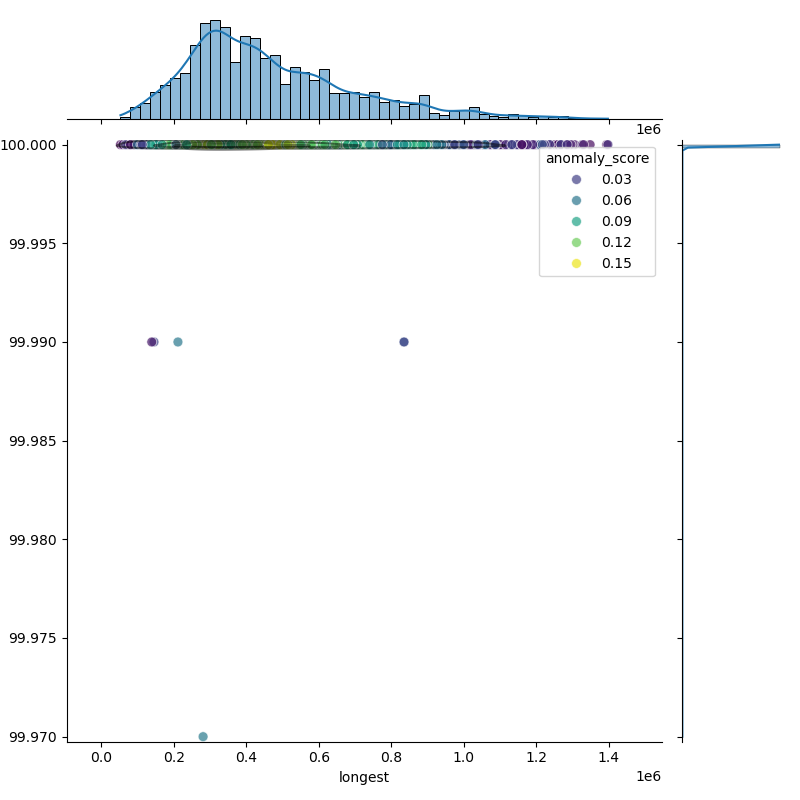
These plots show genomes before and after filtering to highlight the outliers removed:
The filtered distribution shown here may not exactly match the published thresholds because additional rounding and curator adjustments are applied on top.