Survey respondents flagged uncertainty about the no_of_contigs upper bound — some high-quality genomes in their dataset are excluded by the current threshold (Nov 2025 feedback survey). Pending follow-up before any revision.
Derived from 32,386 genomes: 127 from RefSeq and 32,259 from other sources. For the derivation pipeline and the PASS / WARN / FAIL verdict model, see the methods page for qualibact-v1.1.
QualiBact qualibact-v1.1 thresholds for Neisseria meningitidis, refined from v1.0 based on expert-feedback survey (Nov 2025).
The upper bound for assembly size has been tightened from 2.4 Mb to 2.3 Mb at the request of the N. meningitidis subgroup, whose dataset shows genome sizes consistently below 2.3 Mb. The more conservative upper bound flags potentially contaminated or chimeric assemblies that the looser v1.0 threshold would have passed.
All other thresholds inherit from v1.0; see the methods page for qualibact-v1.1 for the full derivation.
This table summarises the distribution of each metric, including standard deviation, mean, median, and percentiles.
A combined summary table across all species is available on the summary page.
| Metric | Distribution | n | Mean | SD | Min | Q1 | Median | Q3 | Max |
|---|---|---|---|---|---|---|---|---|---|
| N50 | non-normal | 32,259 | 46,360 | 13,657 | 12,351 | 35,238 | 47,674 | 57,422 | 116,825 |
| no_of_contigs | non-normal | 32,259 | 187.87 | 38.13 | 72 | 163 | 186 | 210 | 368 |
| longest | non-normal | 32,259 | 154,385 | 44,801 | 47,785 | 120,635 | 154,391 | 176,634 | 391,188 |
| GC_Content | non-normal | 32,259 | 51.72 | 0 | 51.17 | 51.58 | 51.72 | 51.83 | 52.32 |
| Completeness_Specific | non-normal | 32,259 | 99.99 | 0.01 | 99.92 | 99.99 | 99.99 | 100 | 100 |
| Contamination | non-normal | 32,259 | 0.01 | 0.02 | 0 | 0 | 0 | 0.01 | 0.58 |
| Total_Coding_Sequences | non-normal | 32,259 | 2,047 | 57.59 | 1,893 | 2,009 | 2,042 | 2,090 | 2,286 |
| Genome_Size | non-normal | 32,259 | 2,129,830 | 45,394 | 1,994,401 | 2,097,130 | 2,126,679 | 2,164,265 | 2,303,681 |
Full statistics including KS test vs RefSeq and Wasserstein distance are in the downloadable summary.csv.
Derived from 32,386 genomes including 127 RefSeq references
Both Fail and Warn bands shown as the published rounded values — easier to cite and consistent across the species page, CSV downloads, and downstream QC tools.
| Metric | Fail below | Warn below | Warn above | Fail above |
|---|---|---|---|---|
| Genome_Size | 1,800,000 | 2,033,459 | 2,397,461 | 2,300,000 |
| GC_Content | 50 | 51 | 52.2 | 54 |
| Total_Coding_Sequences | 1,700 | 1,926 | 2,420 | 2,700 |
| Completeness_Specific | 96 | 97.12 | - | - |
| Contamination | - | - | 2.47 | 4 |
| N50 | 16,000 | 18,778 | - | - |
| no_of_contigs | - | - | 306 | 340 |
| longest | - | - | - | - |
How to read this: a value between the two warn columns is typical for this species and passes QC. A value between a warn column and the corresponding fail column is borderline — worth a manual look but not an outright failure. A value outside the fail columns is unusual enough to fail QC.
This plot shows the relationship between the number of coding sequences (CDS) and genome size — how the number of genes scales with assembly length. The relationship should be roughly linear: as genome size increases, the number of coding sequences should rise proportionally. A secondary trend line or non-linear behaviour can indicate either bona fide sub-populations within the retained genomes (e.g. distinct sub-clades) or residual contamination that survived filtering.
Histogram comparing SRA to RefSeq; each bar shows genome density across value ranges to highlight shifts, peaks, or outliers.
QQ (quantile-quantile) plot comparing SRA and RefSeq. Points along the diagonal follow the expected distribution; deviations indicate skew, outliers, or other systematic differences.
A table of complete RefSeq genomes for Neisseria meningitidis used to calibrate this scheme. The file includes accessions, some sample information, genome size, GC content, and other key metrics.
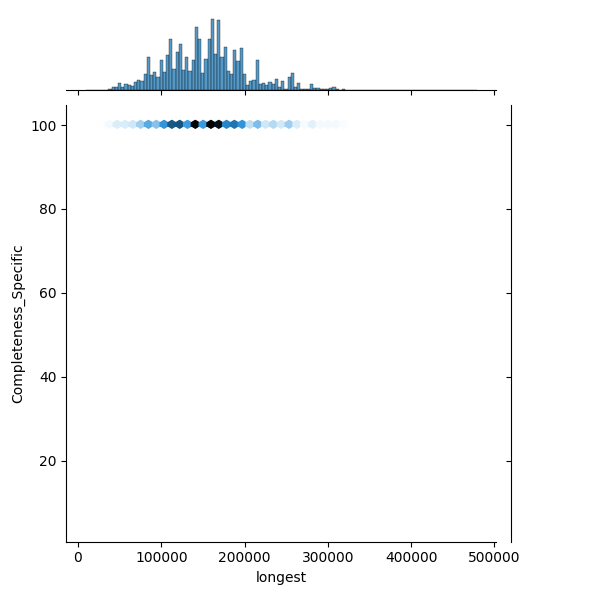
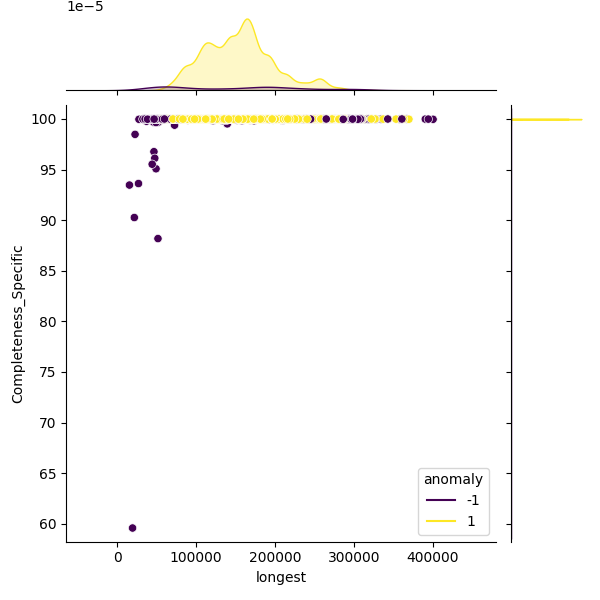
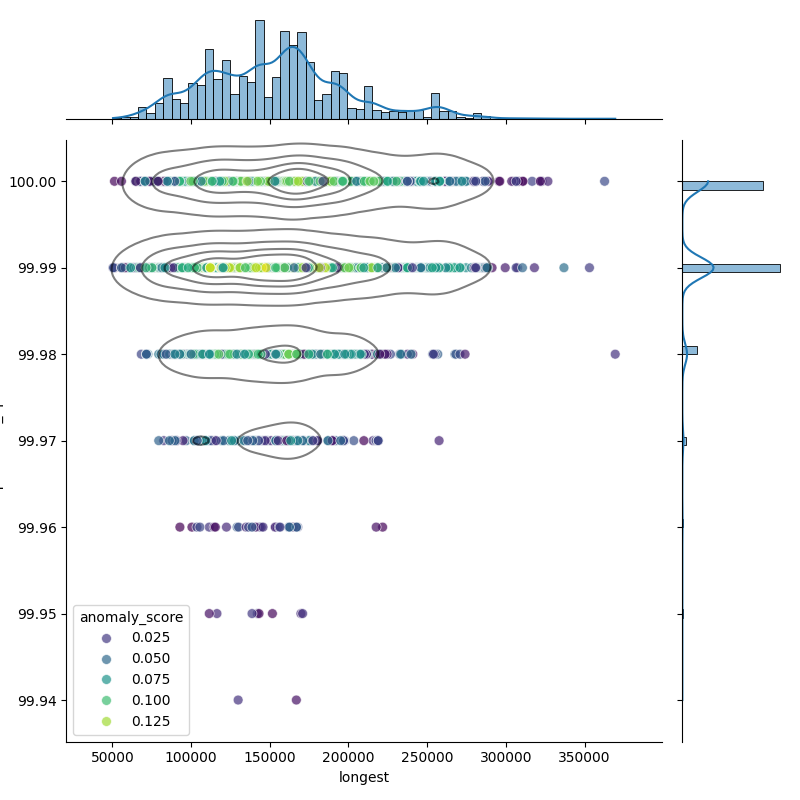
These plots show genomes before and after filtering to highlight the outliers removed:
The filtered distribution shown here may not exactly match the published thresholds because additional rounding and curator adjustments are applied on top.