Neisseria bergeri is a Gram-negative, oxidase-positive diplococcus in the family Neisseriaceae, recently described as a commensal species of the human upper respiratory tract. It was previously classified within Neisseria polysaccharea or related unnamed genomospecies before being resolved as a distinct taxon by whole-genome analyses. N. bergeri lacks the major virulence factors of pathogenic Neisseria species but shares extensive genetic exchange with other members of the genus through natural transformation.
The engine flagged the reference dataset for this species — review the signals below before relying on these thresholds.
Derived from 110 genomes. For the derivation pipeline and the PASS / WARN / FAIL verdict model, see the methods page for qualibact-v1.1.
Applied to the full All-The-Bacteria dataset, these thresholds place 108 genomes at PASS, 10 at WARN, and 14 at FAIL (132 assessed in total). The per-tier genome lists can be downloaded below in .csv.gz format; the FAIL list also records the reason each assembly was rejected.
QualiBact qualibact-v1.1 thresholds for Neisseria bergeri, refined from v1.0 based on the expert-feedback survey (Nov 2025).
Contamination upper bound pinned at 3.0% on the recommendation of the N. gonorrhoeae subgroup. The engine's automatic v1.0 derivation lands tighter than is appropriate for the broader commensal Neisseria distribution; 3.0% is the general threshold the expert group recommends across the commensal species.
All other thresholds inherit unchanged from v1.0. See the methods page for qualibact-v1.1 for the full pipeline.
This table summarises the distribution of each metric, including standard deviation, mean, median, and percentiles.
A combined summary table across all species is available on the summary page.
| Metric | Distribution | n | Mean | SD | Min | Q1 | Median | Q3 | Max |
|---|---|---|---|---|---|---|---|---|---|
| N50 | non-normal | 110 | 240,807 | 105,773 | 96,908 | 176,572 | 226,862 | 275,666 | 556,109 |
| no_of_contigs | non-normal | 110 | 44.4 | 19.4 | 10 | 34 | 44 | 50.75 | 91 |
| longest | non-normal | 110 | 551,783 | 221,359 | 198,134 | 365,237 | 590,482 | 759,858 | 1,018,560 |
| GC_Content | non-normal | 110 | 51.84 | 0.17 | 51.59 | 51.74 | 51.77 | 51.85 | 52.22 |
| Completeness_Specific | normal | 110 | 99.99 | 0.01 | 99.97 | 99.99 | 99.99 | 99.99 | 100 |
| Contamination | non-normal | 110 | 0.03 | 0.02 | 0.01 | 0.01 | 0.02 | 0.03 | 0.11 |
| Total_Coding_Sequences | normal | 110 | 1,987 | 69.37 | 1,860 | 1,967 | 1,984 | 2,032 | 2,194 |
| Genome_Size | normal | 110 | 2,104,207 | 54,826 | 1,998,115 | 2,097,506 | 2,112,509 | 2,132,003 | 2,250,623 |
Full statistics including KS test vs RefSeq and Wasserstein distance are in the downloadable summary.csv.
Derived from 110 genomes
Both Fail and Warn bands shown as the published rounded values — easier to cite and consistent across the species page, CSV downloads, and downstream QC tools.
| Metric | Fail below | Warn below | Warn above | Fail above |
|---|---|---|---|---|
| Genome_Size | 1,900,000 | 2,000,000 | 2,300,000 | 2,300,000 |
| GC_Content | 51.6 | 51.6 | 52.2 | 52.2 |
| Total_Coding_Sequences | 1,800 | 1,800 | 2,200 | 2,200 |
| Completeness_Specific | 99 | 99 | - | - |
| Contamination | - | - | 1 | 3 |
| N50 | 97,000 | 102,000 | - | - |
| no_of_contigs | - | - | 90 | 100 |
| longest | - | - | - | - |
How to read this: a value between the two warn columns is typical for this species and passes QC. A value between a warn column and the corresponding fail column is borderline — worth a manual look but not an outright failure. A value outside the fail columns is unusual enough to fail QC.
The published rounded thresholds (the values in the table above) were applied to the full AllTheBacteria-2024-08 set for this species. Each row carries the per-metric verdict and, where applicable, the reason a genome was demoted to WARN or FAIL. Files are gzipped CSV.
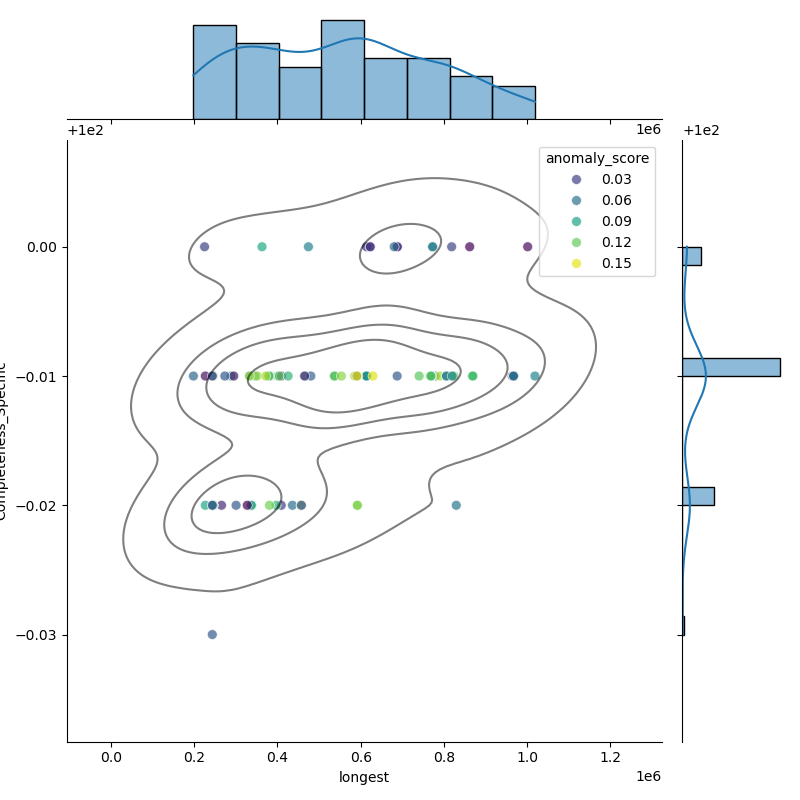
This plot shows the relationship between the number of coding sequences (CDS) and genome size — how the number of genes scales with assembly length. The relationship should be roughly linear: as genome size increases, the number of coding sequences should rise proportionally. A secondary trend line or non-linear behaviour can indicate either bona fide sub-populations within the retained genomes (e.g. distinct sub-clades) or residual contamination that survived filtering.
A table of complete RefSeq genomes for Neisseria bergeri used to calibrate this scheme. The file includes accessions, some sample information, genome size, GC content, and other key metrics.
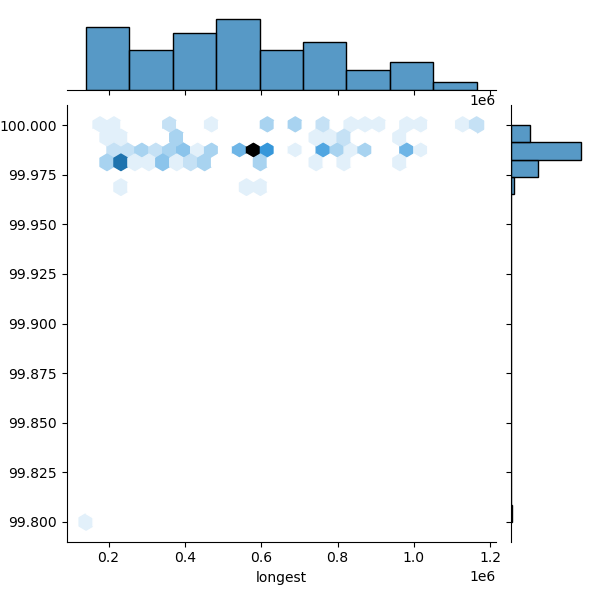
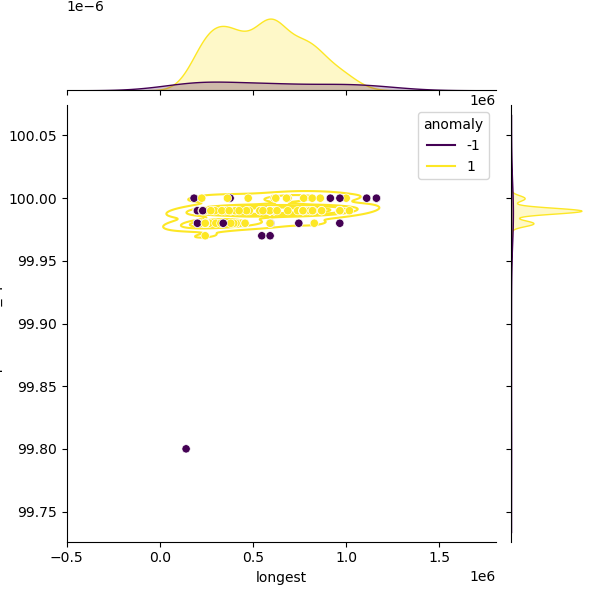
These plots show genomes before and after filtering to highlight the outliers removed:
The filtered distribution shown here may not exactly match the published thresholds because additional rounding and curator adjustments are applied on top.