The reference dataset for this species has substantial quality issues. Thresholds should be treated as indicative only.
Derived from 145 genomes. For the derivation pipeline and the PASS / WARN / FAIL verdict model, see the methods page for qualibact-v1.0.
Applied to the full All-The-Bacteria dataset, these thresholds place 152 genomes at PASS, 9 at WARN, and 15 at FAIL (176 assessed in total). The per-tier genome lists can be downloaded below in .csv.gz format; the FAIL list also records the reason each assembly was rejected.
This table summarises the distribution of each metric, including standard deviation, mean, median, and percentiles.
A combined summary table across all species is available on the summary page.
| Metric | Distribution | n | Mean | SD | Min | Q1 | Median | Q3 | Max |
|---|---|---|---|---|---|---|---|---|---|
| N50 | non-normal | 145 | 73,919 | 56,072 | 17,509 | 34,505 | 39,802 | 121,754 | 266,553 |
| no_of_contigs | non-normal | 145 | 58.99 | 36.99 | 5 | 14 | 75 | 87 | 161 |
| longest | non-normal | 145 | 146,806 | 72,835 | 44,073 | 93,712 | 103,974 | 219,784 | 275,583 |
| GC_Content | non-normal | 145 | 23.94 | 0.13 | 23.7 | 23.87 | 23.87 | 24.12 | 24.13 |
| Completeness_Specific | non-normal | 145 | 95.36 | 6.12 | 85.15 | 86.37 | 99.36 | 99.64 | 99.89 |
| Contamination | non-normal | 145 | 0.11 | 0.22 | 0 | 0.01 | 0.05 | 0.08 | 1.64 |
| Total_Coding_Sequences | non-normal | 145 | 771.71 | 204.6 | 465 | 468 | 902 | 911 | 971 |
| Genome_Size | non-normal | 145 | 897,996 | 240,649 | 538,708 | 539,616 | 1,054,668 | 1,056,061 | 1,082,538 |
Full statistics including KS test vs RefSeq and Wasserstein distance are in the downloadable summary.csv.
Derived from 145 genomes
Both Fail and Warn bands shown as the published rounded values — easier to cite and consistent across the species page, CSV downloads, and downstream QC tools.
| Metric | Fail below | Warn below | Warn above | Fail above |
|---|---|---|---|---|
| Genome_Size | 500,000 | 500,000 | 1,100,000 | 1,100,000 |
| GC_Content | 23.7 | 23.7 | 24.2 | 24.2 |
| Total_Coding_Sequences | 400 | 400 | 1,000 | 1,000 |
| Completeness_Specific | 85 | 85 | - | - |
| Contamination | - | - | 1 | 2 |
| N50 | 19,000 | 24,000 | - | - |
| no_of_contigs | - | - | 120 | 140 |
| longest | - | - | - | - |
How to read this: a value between the two warn columns is typical for this species and passes QC. A value between a warn column and the corresponding fail column is borderline — worth a manual look but not an outright failure. A value outside the fail columns is unusual enough to fail QC.
The published rounded thresholds (the values in the table above) were applied to the full AllTheBacteria-2024-08 set for this species. Each row carries the per-metric verdict and, where applicable, the reason a genome was demoted to WARN or FAIL. Files are gzipped CSV.
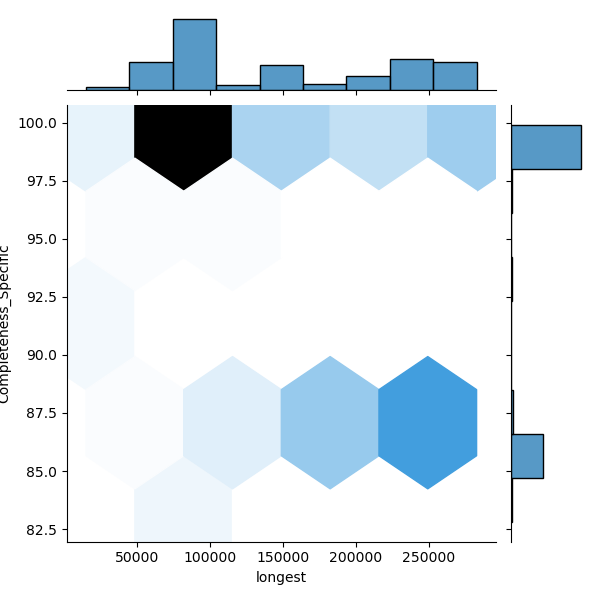
This plot shows the relationship between the number of coding sequences (CDS) and genome size — how the number of genes scales with assembly length. The relationship should be roughly linear: as genome size increases, the number of coding sequences should rise proportionally. A secondary trend line or non-linear behaviour can indicate either bona fide sub-populations within the retained genomes (e.g. distinct sub-clades) or residual contamination that survived filtering.
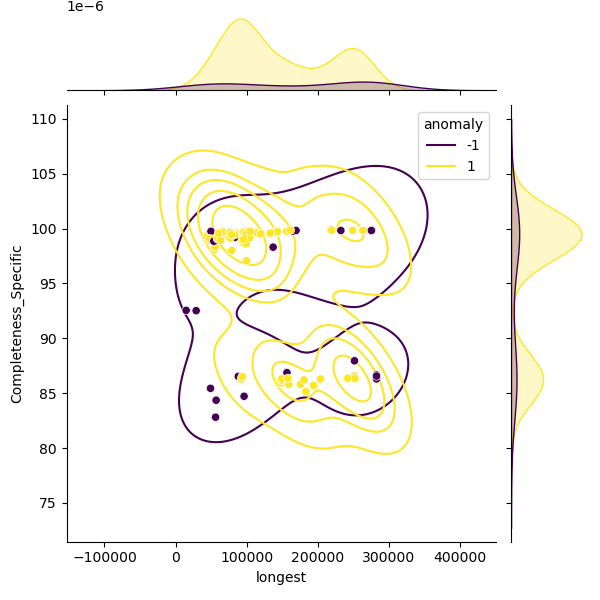
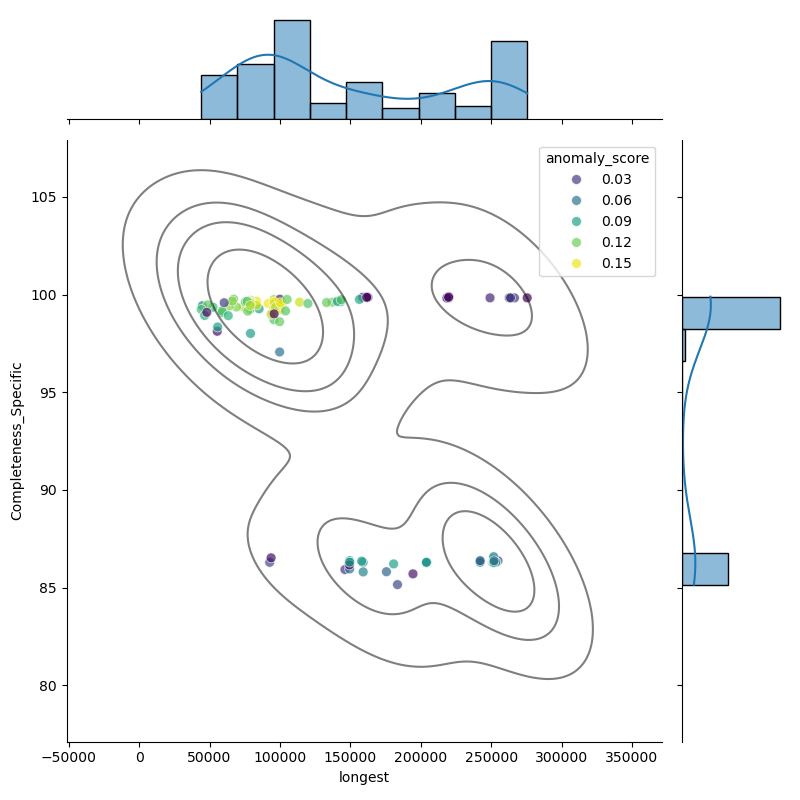
These plots show genomes before and after filtering to highlight the outliers removed:
The filtered distribution shown here may not exactly match the published thresholds because additional rounding and curator adjustments are applied on top.