Helicobacter pylori is a Gram-negative, microaerophilic, spiral-shaped rod in the family Helicobacteraceae, uniquely adapted to colonise the human gastric mucosa through the production of urease that neutralises stomach acid. It infects approximately half of the global population and is the primary cause of chronic gastritis, peptic ulcer disease, and is classified as a class I carcinogen due to its strong association with gastric adenocarcinoma and mucosa-associated lymphoid tissue (MALT) lymphoma. H. pylori exhibits exceptional genomic diversity driven by high mutation and recombination rates, reflecting a long co-evolutionary history with its human host spanning at least 100,000 years.
For detailed methods on how these thresholds were calculated, please see Methods. The suggested thresholds are in the table below. These thresholds are based on 372 genomes from RefSeq and 1655 genomes from other sources. These thresholds were applied to all the bacteria dataset, which resulted in removing 101 and retaining 1926. The list of genomes retained (i.e. high quality) and the list of genomes rejected (filtered) can be downloaded below. These files are in .xz format. The rejected genomes file also includes the reason why.
These tables provide a summary of the distribution of each metric, including SDeviation, Mean, Median, and Percentiles.
These thresholds were applied to all the bacteria dataset. The list of genomes retained (i.e. high quality) and the list of genomes rejected (filtered) can be downloaded below. These files are in .xz format. The rejected genomes file also includes the reason why.
| Metric | Lower bound | Upper bound |
|---|---|---|
| N50 | 32,000 | - |
| no_of_contigs | - | 130.0 |
| GC_Content | 38.00 | 40.00 |
| Completeness | 95.00 | - |
| Contamination | - | 2.000 |
| Total_Coding_Sequences | 1,400 | 1,700 |
| Genome_Size | 1,500,000 | 1,800,000 |
This plot shows the relationship between the number of coding sequences (CDS) and genome size. It helps to visualize how genome size correlates with the number of genes. This should be linear – as genome size increases, the number of coding sequences should also increase. Any secondary trend lines or non-linear behaviour indicates bona fide separate populations within the retained genomes or some remaining contaminant.
Histogram comparing SRA to RefSeq; each bar shows genome density across value ranges to highlight shifts, peaks, or outliers.
QQ (quantile-quantile) plot comparing SRA and RefSeq. Points along the diagonal follow the expected distribution; deviations indicate skew, outliers, or other systematic differences.
A table of complete RefSeq genomes for Helicobacter pylori used to calibrate this scheme. The file includes accessions, some sample information, genome size, GC content, and other key metrics.
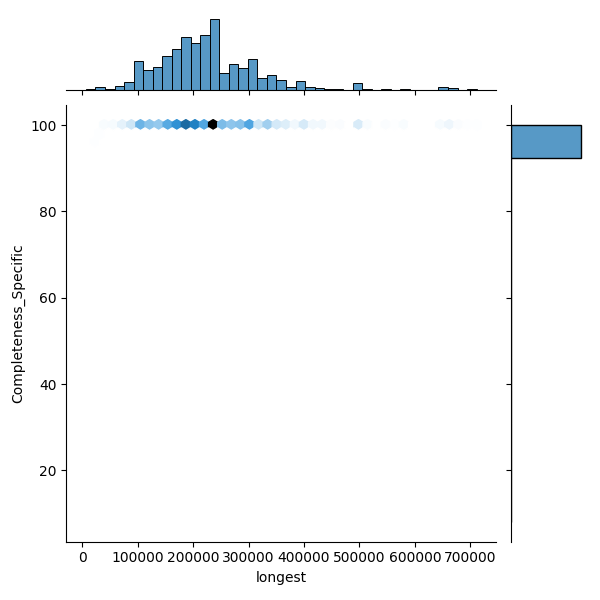
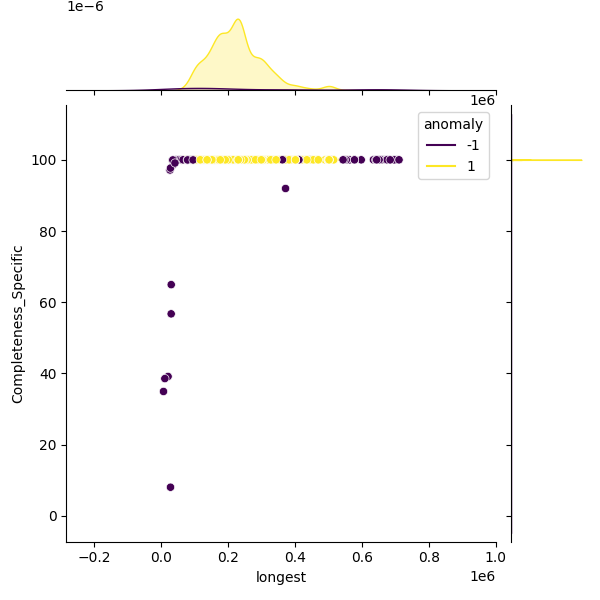
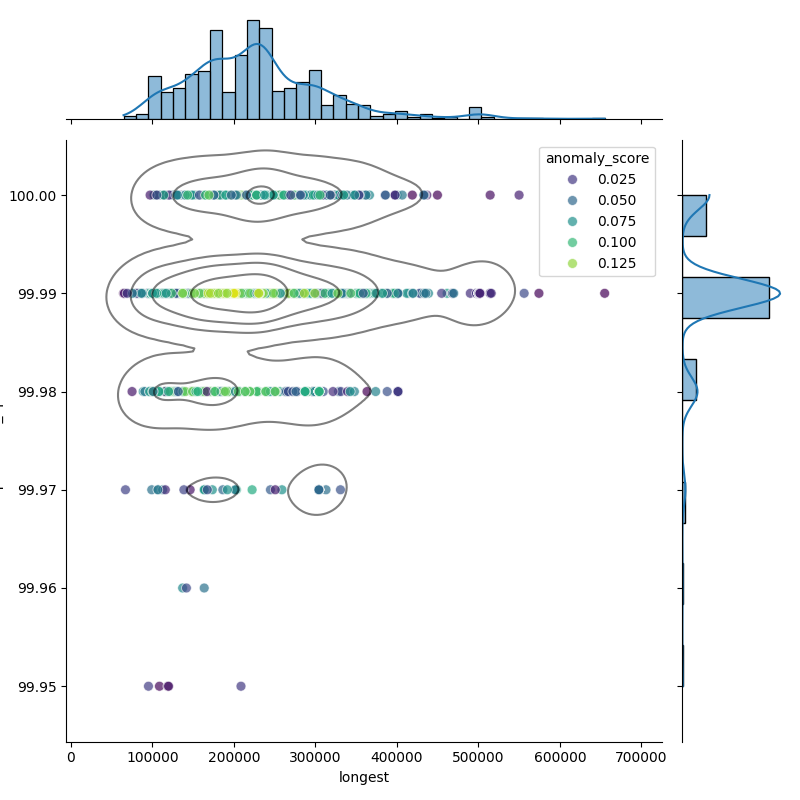
These plots show genomes before and after filtering to highlight the outliers removed. Left: Heatmap of all genomes in the dataset. Middle: A representative sample of genomes, with anomalies highlighted (purple). Right: The filtered distribution after applying filtering. There may have been additional adjustments and rounding so the distribution here may not enirely match with the final suggested metrics.