Derived from 1,157 genomes: 503 from RefSeq and 654 from other sources. For the derivation pipeline and the PASS / WARN / FAIL verdict model, see the methods page for qualibact-v1.1.
QualiBact qualibact-v1.1 thresholds for Campylobacter jejuni, derived from a curated 654-genome ATB subset re-run with qualibact-engine for v1.1.
Compared with v1.0, the curated re-run pulls several bounds inward:
Assembly-size upper bound pinned at 2.1 Mb on advice from the Campylobacter jejuni subgroup (INSA Lisboa Campylobacter subgroup). The engine emitted 2.0 Mb for the curated run, but expert review of a diverse isolate set (human + food + animal + environmental) showed that 2.0 Mb was excluding a small number of well-supported, high-quality genomes; 2.1 Mb retains them.
See the methods page for qualibact-v1.1 for details on how thresholds are derived overall.
Threshold values and rationale for Campylobacter jejuni (qualibact-v1.1) contributed by:
Supported by: Instituto Nacional de Saúde Doutor Ricardo Jorge; GENEO project (Project No. 101113460; co-funded by the European Union under the EU4Health Programme (EU4H)).
This table summarises the distribution of each metric, including standard deviation, mean, median, and percentiles.
A combined summary table across all species is available on the summary page.
| Metric | Distribution | n | Mean | SD | Min | Q1 | Median | Q3 | Max |
|---|---|---|---|---|---|---|---|---|---|
| N50 | non-normal | 654 | 120,912 | 46,818 | 26,656 | 90,271 | 114,133 | 153,698 | 367,700 |
| no_of_contigs | non-normal | 654 | 50.53 | 19.24 | 19 | 36 | 47.5 | 61 | 133 |
| longest | non-normal | 654 | 259,082 | 95,375 | 55,057 | 185,962 | 243,187 | 331,194 | 687,769 |
| GC_Content | non-normal | 654 | 30.06 | 0.23 | 30 | 30 | 30 | 30 | 31 |
| Completeness_Specific | non-normal | 654 | 99.98 | 0.01 | 99.88 | 99.98 | 99.98 | 99.99 | 100 |
| Contamination | non-normal | 654 | 0.3 | 0.99 | 0 | 0.04 | 0.06 | 0.1 | 9.02 |
| Total_Coding_Sequences | non-normal | 654 | 1,800 | 81.89 | 1,600 | 1,738 | 1,806 | 1,860 | 2,016 |
| Genome_Size | non-normal | 654 | 1,701,237 | 55,398 | 1,561,682 | 1,657,036 | 1,703,256 | 1,738,319 | 1,877,537 |
Full statistics including KS test vs RefSeq and Wasserstein distance are in the downloadable summary.csv.
Derived from 1,157 genomes including 503 RefSeq references
Both Fail and Warn bands shown as the published rounded values — easier to cite and consistent across the species page, CSV downloads, and downstream QC tools.
| Metric | Fail below | Warn below | Warn above | Fail above |
|---|---|---|---|---|
| Genome_Size | 1,500,000 | 1,600,000 | 1,900,000 | 2,100,000 |
| GC_Content | 30 | 30 | 31 | 31 |
| Total_Coding_Sequences | 1,600 | 1,600 | 2,000 | 2,200 |
| Completeness_Specific | 95 | 99 | - | - |
| Contamination | - | - | 4 | 10 |
| N50 | 36,000 | 46,000 | - | - |
| no_of_contigs | - | - | 100 | 120 |
| longest | - | - | - | - |
How to read this: a value between the two warn columns is typical for this species and passes QC. A value between a warn column and the corresponding fail column is borderline — worth a manual look but not an outright failure. A value outside the fail columns is unusual enough to fail QC.
This plot shows the relationship between the number of coding sequences (CDS) and genome size — how the number of genes scales with assembly length. The relationship should be roughly linear: as genome size increases, the number of coding sequences should rise proportionally. A secondary trend line or non-linear behaviour can indicate either bona fide sub-populations within the retained genomes (e.g. distinct sub-clades) or residual contamination that survived filtering.
Histogram comparing SRA to RefSeq; each bar shows genome density across value ranges to highlight shifts, peaks, or outliers.
QQ (quantile-quantile) plot comparing SRA and RefSeq. Points along the diagonal follow the expected distribution; deviations indicate skew, outliers, or other systematic differences.
A table of complete RefSeq genomes for Campylobacter jejuni used to calibrate this scheme. The file includes accessions, some sample information, genome size, GC content, and other key metrics.
Per-assembly inputs the engine used to derive the Campylobacter jejuni reference distribution for this scheme: sample, sylph species call, N50, contig count, longest contig, total length, completeness, contamination, total coding sequences, genome size, GC content. Gzipped CSV.
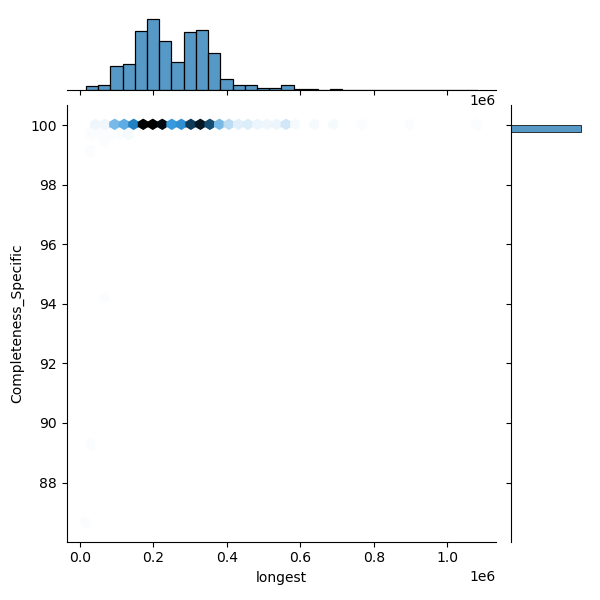
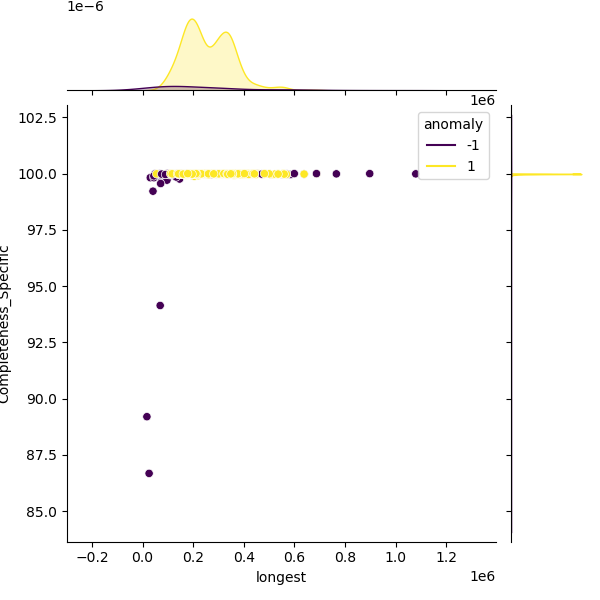
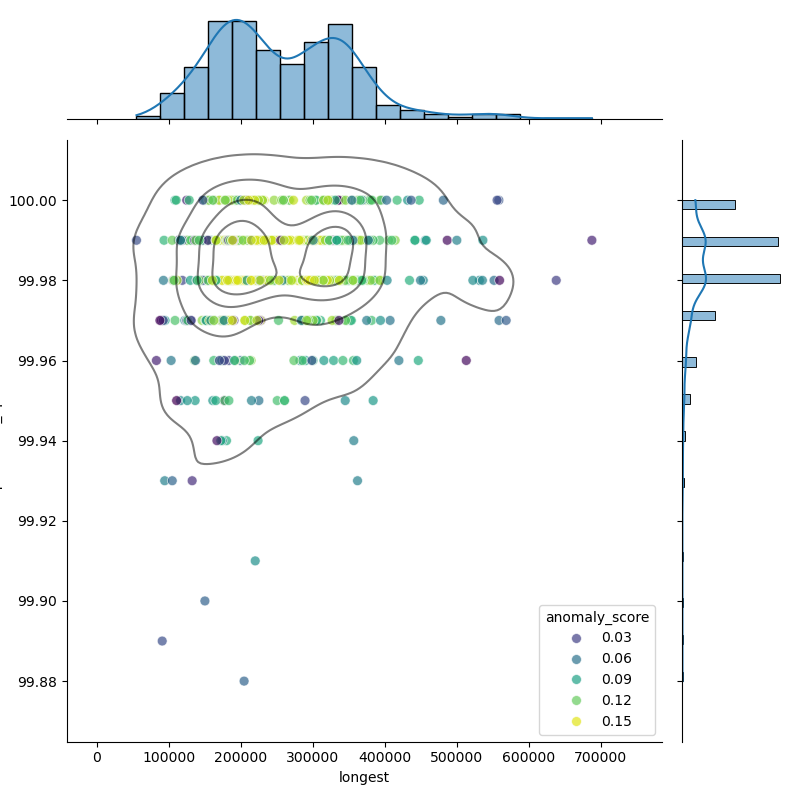
These plots show genomes before and after filtering to highlight the outliers removed:
The filtered distribution shown here may not exactly match the published thresholds because additional rounding and curator adjustments are applied on top.