Campylobacter coli is a Gram-negative, microaerophilic, spiral-shaped rod of the family Campylobacteraceae, primarily associated with pigs but also found in poultry and other livestock. It is the second most common cause of human campylobacteriosis after C. jejuni, causing acute gastroenteritis characterised by diarrhoea, abdominal pain, and fever. C. coli genomes are approximately 1.7 Mb in size, and the species shows high rates of inter- and intraspecific recombination, particularly with C. jejuni, complicating phylogenetic delineation.
The engine flagged the reference dataset for this species — review the signals below before relying on these thresholds.
Derived from 190 genomes: 92 from RefSeq and 98 from other sources. For the derivation pipeline and the PASS / WARN / FAIL verdict model, see the methods page for qualibact-v1.1.
QualiBact qualibact-v1.1 thresholds for Campylobacter coli, derived from a curated reference set (98 ATB assemblies + 92 RefSeq references) rather than the full AllTheBacteria-2024-08 distribution used for v1.0.
Compared with v1.0, the tighter reference set pulls a number of bounds inward — most visibly:
The underlying engine pipeline, outlier detection, and PASS / WARN / FAIL verdict logic are unchanged from v1.0. See the methods page for qualibact-v1.1 for details on how the v1.1 thresholds are derived and which species are part of the v1.1 track.
Threshold values and rationale for Campylobacter coli (qualibact-v1.1) contributed by:
Supported by: Instituto Nacional de Saúde Doutor Ricardo Jorge; GENEO project (Project No. 101113460; co-funded by the European Union under the EU4Health Programme (EU4H)).
This table summarises the distribution of each metric, including standard deviation, mean, median, and percentiles.
A combined summary table across all species is available on the summary page.
| Metric | Distribution | n | Mean | SD | Min | Q1 | Median | Q3 | Max |
|---|---|---|---|---|---|---|---|---|---|
| N50 | normal | 98 | 135,128 | 56,923 | 30,451 | 98,994 | 139,240 | 170,963 | 265,739 |
| no_of_contigs | non-normal | 98 | 46.07 | 24.05 | 20 | 28 | 38 | 55.75 | 119 |
| longest | non-normal | 98 | 276,311 | 87,198 | 91,646 | 222,987 | 280,950 | 354,885 | 407,525 |
| GC_Content | non-normal | 98 | 31 | 0 | 31 | 31 | 31 | 31 | 31 |
| Completeness_Specific | non-normal | 98 | 99.97 | 0.02 | 99.91 | 99.97 | 99.97 | 99.98 | 99.99 |
| Contamination | non-normal | 98 | 0.03 | 0.03 | 0.01 | 0.02 | 0.02 | 0.04 | 0.26 |
| Total_Coding_Sequences | non-normal | 98 | 1,762 | 64.51 | 1,662 | 1,709 | 1,750 | 1,792 | 1,930 |
| Genome_Size | non-normal | 98 | 1,691,296 | 41,939 | 1,635,349 | 1,658,145 | 1,686,722 | 1,716,153 | 1,820,940 |
Full statistics including KS test vs RefSeq and Wasserstein distance are in the downloadable summary.csv.
Derived from 190 genomes including 92 RefSeq references
Both Fail and Warn bands shown as the published rounded values — easier to cite and consistent across the species page, CSV downloads, and downstream QC tools.
| Metric | Fail below | Warn below | Warn above | Fail above |
|---|---|---|---|---|
| Genome_Size | 1,600,000 | 1,600,000 | 1,800,000 | 2,200,000 |
| GC_Content | 30 | 31 | 31 | 32 |
| Total_Coding_Sequences | 1,600 | 1,600 | 2,000 | 2,400 |
| Completeness_Specific | 94 | 99 | - | - |
| Contamination | - | - | 1 | 13 |
| N50 | 31,000 | 32,000 | - | - |
| no_of_contigs | - | - | 110 | 120 |
| longest | - | - | - | - |
How to read this: a value between the two warn columns is typical for this species and passes QC. A value between a warn column and the corresponding fail column is borderline — worth a manual look but not an outright failure. A value outside the fail columns is unusual enough to fail QC.
Histogram comparing SRA to RefSeq; each bar shows genome density across value ranges to highlight shifts, peaks, or outliers.
QQ (quantile-quantile) plot comparing SRA and RefSeq. Points along the diagonal follow the expected distribution; deviations indicate skew, outliers, or other systematic differences.
A table of complete RefSeq genomes for Campylobacter coli used to calibrate this scheme. The file includes accessions, some sample information, genome size, GC content, and other key metrics.
Per-assembly inputs the engine used to derive the Campylobacter coli reference distribution for this scheme: sample, sylph species call, N50, contig count, longest contig, total length, completeness, contamination, total coding sequences, genome size, GC content. Gzipped CSV.
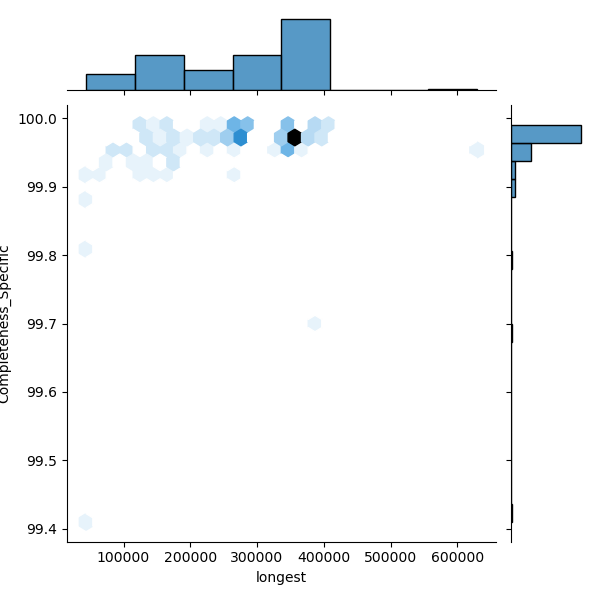
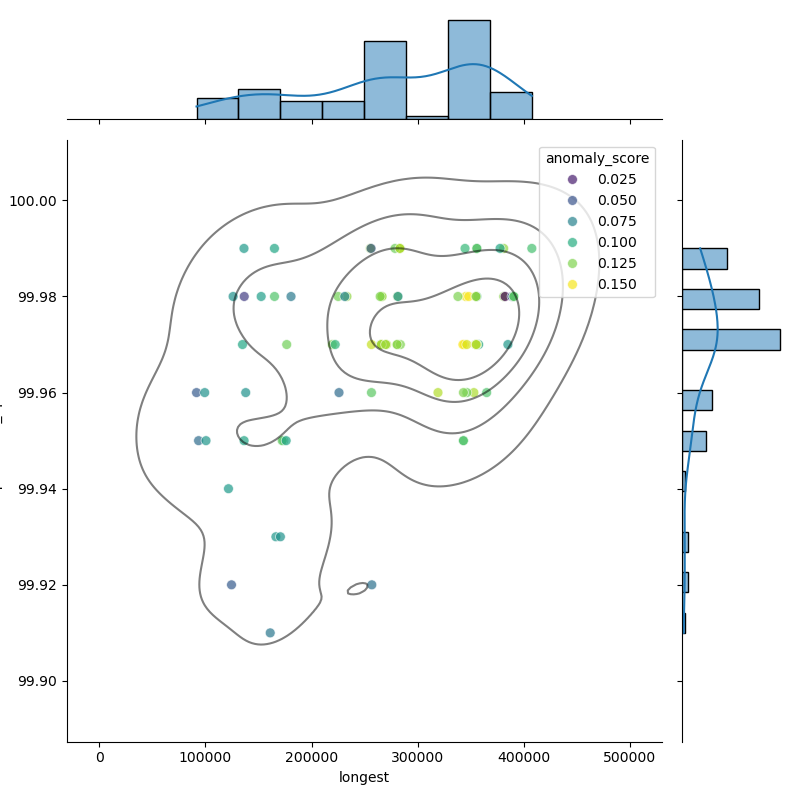
These plots show genomes before and after filtering to highlight the outliers removed:
The filtered distribution shown here may not exactly match the published thresholds because additional rounding and curator adjustments are applied on top.