Bacillus subtilis is an aerobic, endospore-forming Gram-positive rod in the family Bacillaceae, commonly found in soil and associated plant surfaces. It is the best-studied Gram-positive model organism, with strain 168 serving as a reference for sporulation, competence, biofilm formation, and secondary metabolism, and it holds GRAS status for use in industrial enzyme production and as a probiotic in animal feed. B. subtilis has a genome of approximately 4.2 Mb encoding a large number of secondary metabolite biosynthetic clusters, and it displays natural genetic competence, making it a workhorse for Gram-positive genetics and biotechnology.
The engine flagged the reference dataset for this species — review the signals below before relying on these thresholds.
Derived from 2,364 genomes: 418 from RefSeq and 1,946 from other sources. For the derivation pipeline and the PASS / WARN / FAIL verdict model, see the methods page for qualibact-v1.0.
Applied to the full All-The-Bacteria dataset, these thresholds place 1,745 genomes at PASS, 273 at WARN, and 141 at FAIL (2,159 assessed in total). The per-tier genome lists can be downloaded below in .csv.gz format; the FAIL list also records the reason each assembly was rejected.
This table summarises the distribution of each metric, including standard deviation, mean, median, and percentiles.
A combined summary table across all species is available on the summary page.
| Metric | Distribution | n | Mean | SD | Min | Q1 | Median | Q3 | Max |
|---|---|---|---|---|---|---|---|---|---|
| N50 | non-normal | 1,946 | 1,031,987 | 683,319 | 31,505 | 580,312 | 931,703 | 1,048,613 | 2,294,043 |
| no_of_contigs | non-normal | 1,946 | 44.18 | 36.26 | 16 | 26 | 33 | 40 | 348 |
| longest | non-normal | 1,946 | 1,298,540 | 621,807 | 106,497 | 1,015,372 | 1,073,408 | 2,057,004 | 2,294,043 |
| GC_Content | non-normal | 1,946 | 43.51 | 0.21 | 42.93 | 43.29 | 43.44 | 43.72 | 44.03 |
| Completeness_Specific | non-normal | 1,946 | 100 | 0.01 | 99.71 | 100 | 100 | 100 | 100 |
| Contamination | non-normal | 1,946 | 0.22 | 0.28 | 0 | 0.04 | 0.09 | 0.43 | 2.3 |
| Total_Coding_Sequences | non-normal | 1,946 | 4,165 | 156.51 | 3,807 | 4,012 | 4,221 | 4,315 | 4,635 |
| Genome_Size | non-normal | 1,946 | 4,115,334 | 123,702 | 3,829,812 | 3,990,786 | 4,161,774 | 4,245,874 | 4,358,602 |
Full statistics including KS test vs RefSeq and Wasserstein distance are in the downloadable summary.csv.
Derived from 2,364 genomes including 418 RefSeq references
Both Fail and Warn bands shown as the published rounded values — easier to cite and consistent across the species page, CSV downloads, and downstream QC tools.
| Metric | Fail below | Warn below | Warn above | Fail above |
|---|---|---|---|---|
| Genome_Size | 3,600,000 | 3,800,000 | 4,300,000 | 4,800,000 |
| GC_Content | 42.8 | 43.2 | 43.9 | 44.1 |
| Total_Coding_Sequences | 3,800 | 3,800 | 4,400 | 5,000 |
| Completeness_Specific | 92 | 100 | - | - |
| Contamination | - | - | 1 | 16 |
| N50 | 49,000 | 66,000 | - | - |
| no_of_contigs | - | - | 170 | 200 |
| longest | - | - | - | - |
How to read this: a value between the two warn columns is typical for this species and passes QC. A value between a warn column and the corresponding fail column is borderline — worth a manual look but not an outright failure. A value outside the fail columns is unusual enough to fail QC.
The published rounded thresholds (the values in the table above) were applied to the full AllTheBacteria-2024-08 set for this species. Each row carries the per-metric verdict and, where applicable, the reason a genome was demoted to WARN or FAIL. Files are gzipped CSV.
This plot shows the relationship between the number of coding sequences (CDS) and genome size — how the number of genes scales with assembly length. The relationship should be roughly linear: as genome size increases, the number of coding sequences should rise proportionally. A secondary trend line or non-linear behaviour can indicate either bona fide sub-populations within the retained genomes (e.g. distinct sub-clades) or residual contamination that survived filtering.
Histogram comparing SRA to RefSeq; each bar shows genome density across value ranges to highlight shifts, peaks, or outliers.
QQ (quantile-quantile) plot comparing SRA and RefSeq. Points along the diagonal follow the expected distribution; deviations indicate skew, outliers, or other systematic differences.
A table of complete RefSeq genomes for Bacillus subtilis used to calibrate this scheme. The file includes accessions, some sample information, genome size, GC content, and other key metrics.
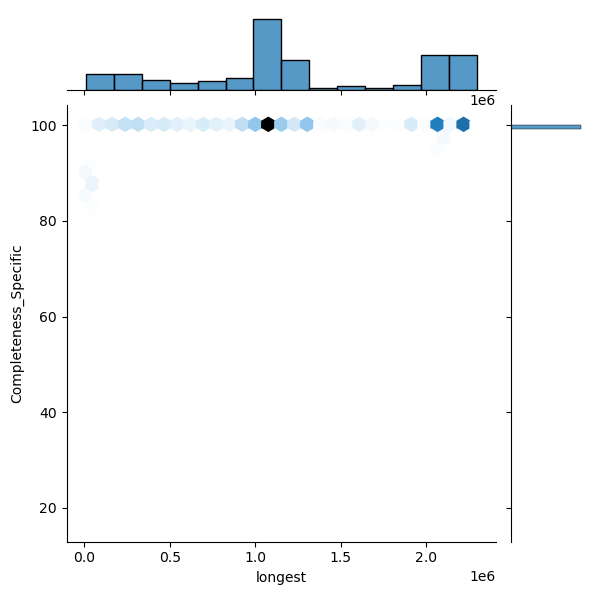
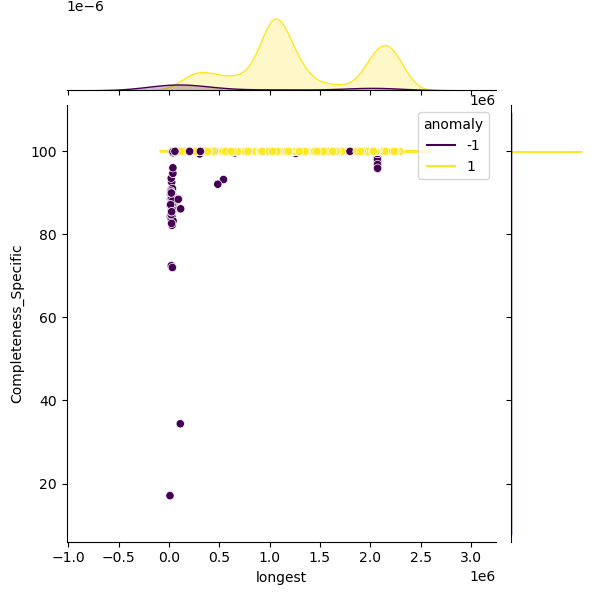
These plots show genomes before and after filtering to highlight the outliers removed:
The filtered distribution shown here may not exactly match the published thresholds because additional rounding and curator adjustments are applied on top.