Bacillus subtilis is an aerobic, endospore-forming Gram-positive rod in the family Bacillaceae, commonly found in soil and associated plant surfaces. It is the best-studied Gram-positive model organism, with strain 168 serving as a reference for sporulation, competence, biofilm formation, and secondary metabolism, and it holds GRAS status for use in industrial enzyme production and as a probiotic in animal feed. B. subtilis has a genome of approximately 4.2 Mb encoding a large number of secondary metabolite biosynthetic clusters, and it displays natural genetic competence, making it a workhorse for Gram-positive genetics and biotechnology.
For detailed methods on how these thresholds were calculated, please see Methods. The suggested thresholds are in the table below. These thresholds are based on 375 genomes from RefSeq and 1822 genomes from other sources. These thresholds were applied to all the bacteria dataset, which resulted in removing 143 and retaining 2054. The list of genomes retained (i.e. high quality) and the list of genomes rejected (filtered) can be downloaded below. These files are in .xz format. The rejected genomes file also includes the reason why.
These tables provide a summary of the distribution of each metric, including SDeviation, Mean, Median, and Percentiles.
These thresholds were applied to all the bacteria dataset. The list of genomes retained (i.e. high quality) and the list of genomes rejected (filtered) can be downloaded below. These files are in .xz format. The rejected genomes file also includes the reason why.
| Metric | Lower bound | Upper bound |
|---|---|---|
| N50 | 23,000 | - |
| no_of_contigs | - | 470.0 |
| GC_Content | 42.00 | 45.00 |
| Completeness | 92.00 | - |
| Contamination | - | 12.00 |
| Total_Coding_Sequences | 3,800 | 5,000 |
| Genome_Size | 3,600,000 | 4,600,000 |
This plot shows the relationship between the number of coding sequences (CDS) and genome size. It helps to visualize how genome size correlates with the number of genes. This should be linear – as genome size increases, the number of coding sequences should also increase. Any secondary trend lines or non-linear behaviour indicates bona fide separate populations within the retained genomes or some remaining contaminant.
Histogram comparing SRA to RefSeq; each bar shows genome density across value ranges to highlight shifts, peaks, or outliers.
QQ (quantile-quantile) plot comparing SRA and RefSeq. Points along the diagonal follow the expected distribution; deviations indicate skew, outliers, or other systematic differences.
A table of complete RefSeq genomes for Bacillus subtilis used to calibrate this scheme. The file includes accessions, some sample information, genome size, GC content, and other key metrics.
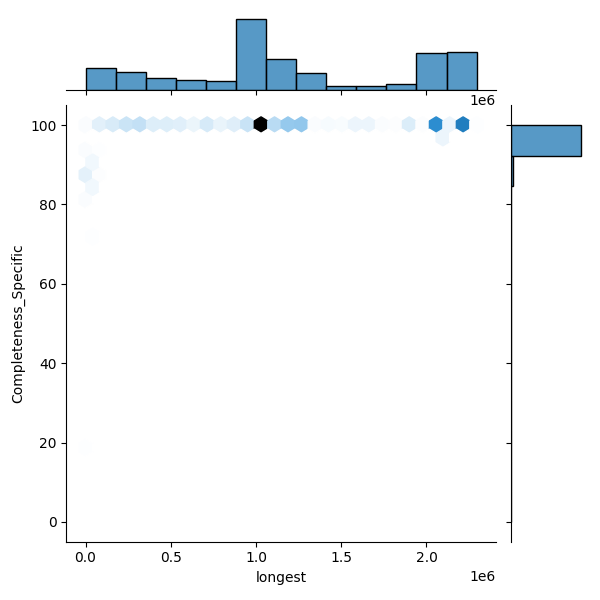
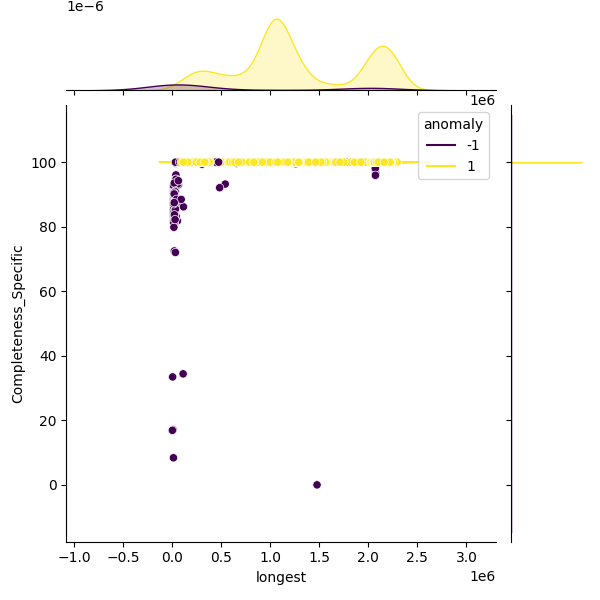
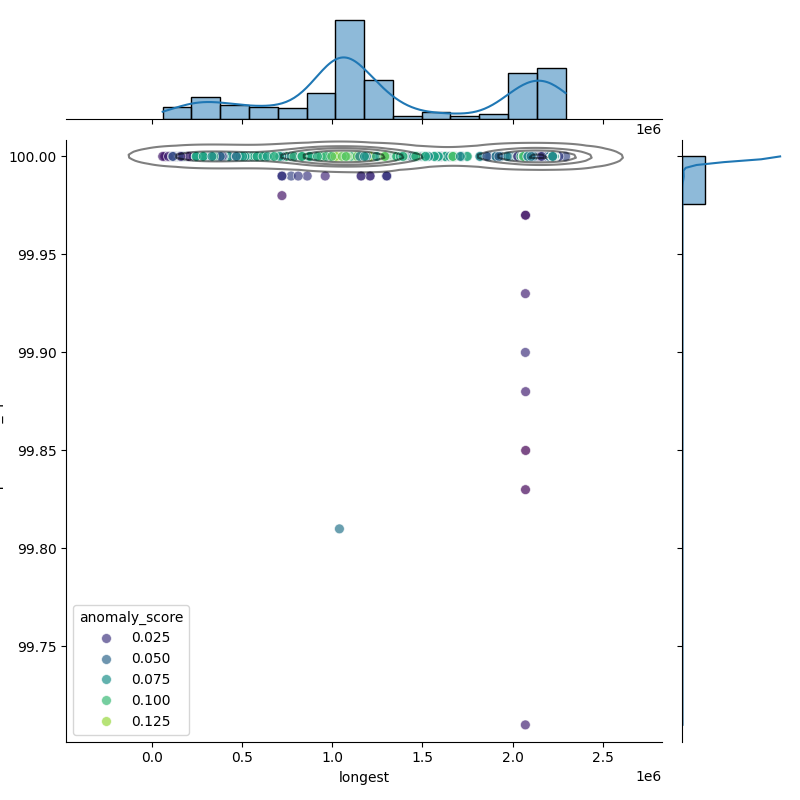
These plots show genomes before and after filtering to highlight the outliers removed. Left: Heatmap of all genomes in the dataset. Middle: A representative sample of genomes, with anomalies highlighted (purple). Right: The filtered distribution after applying filtering. There may have been additional adjustments and rounding so the distribution here may not enirely match with the final suggested metrics.