Bacillus mobilis is an aerobic, endospore-forming, motile Gram-positive rod in the family Bacillaceae, classified within the Bacillus cereus sensu lato group. It was recently delineated as a distinct genomospecies based on whole-genome analyses and has been isolated from diverse environments including soil, food, and clinical specimens. B. mobilis shares the core chromosomal architecture of the B. cereus group and may carry enterotoxin genes, though its clinical and ecological significance remains less well characterised than that of B. cereus or B. thuringiensis.
For detailed methods on how these thresholds were calculated, please see Methods. The suggested thresholds are in the table below. These thresholds are based on 0 genomes from RefSeq and 148 genomes from other sources. These thresholds were applied to all the bacteria dataset, which resulted in removing 7 and retaining 141. The list of genomes retained (i.e. high quality) and the list of genomes rejected (filtered) can be downloaded below. These files are in .xz format. The rejected genomes file also includes the reason why.
These tables provide a summary of the distribution of each metric, including SDeviation, Mean, Median, and Percentiles.
These thresholds were applied to all the bacteria dataset. The list of genomes retained (i.e. high quality) and the list of genomes rejected (filtered) can be downloaded below. These files are in .xz format. The rejected genomes file also includes the reason why.
| Metric | Lower bound | Upper bound |
|---|---|---|
| N50 | 17,000 | - |
| no_of_contigs | - | 790.0 |
| GC_Content | 35.00 | 36.00 |
| Completeness | 100.0 | - |
| Contamination | - | 2.000 |
| Total_Coding_Sequences | 5,300 | 6,300 |
| Genome_Size | 5,200,000 | 6,100,000 |
This plot shows the relationship between the number of coding sequences (CDS) and genome size. It helps to visualize how genome size correlates with the number of genes. This should be linear – as genome size increases, the number of coding sequences should also increase. Any secondary trend lines or non-linear behaviour indicates bona fide separate populations within the retained genomes or some remaining contaminant.
A table of complete RefSeq genomes for Bacillus mobilis used to calibrate this scheme. The file includes accessions, some sample information, genome size, GC content, and other key metrics.
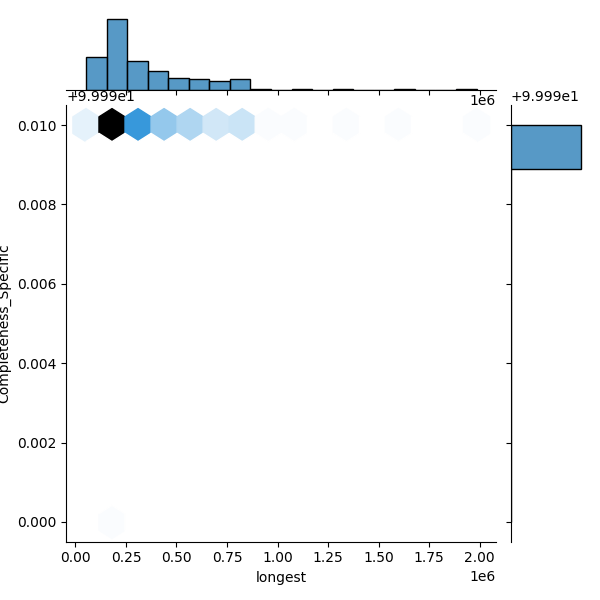
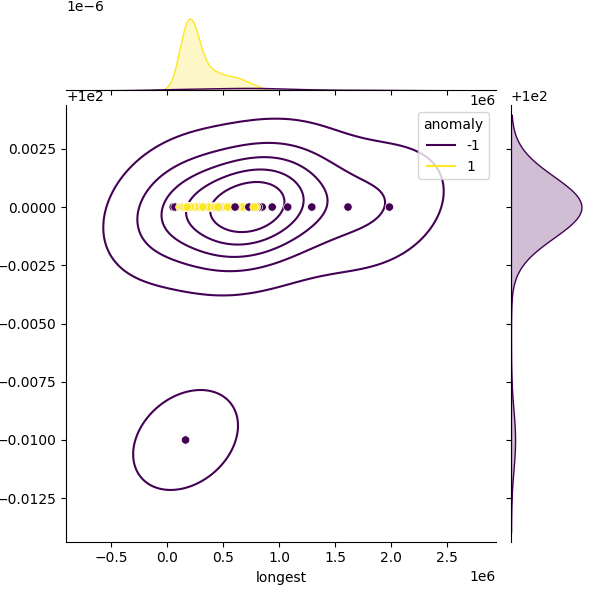
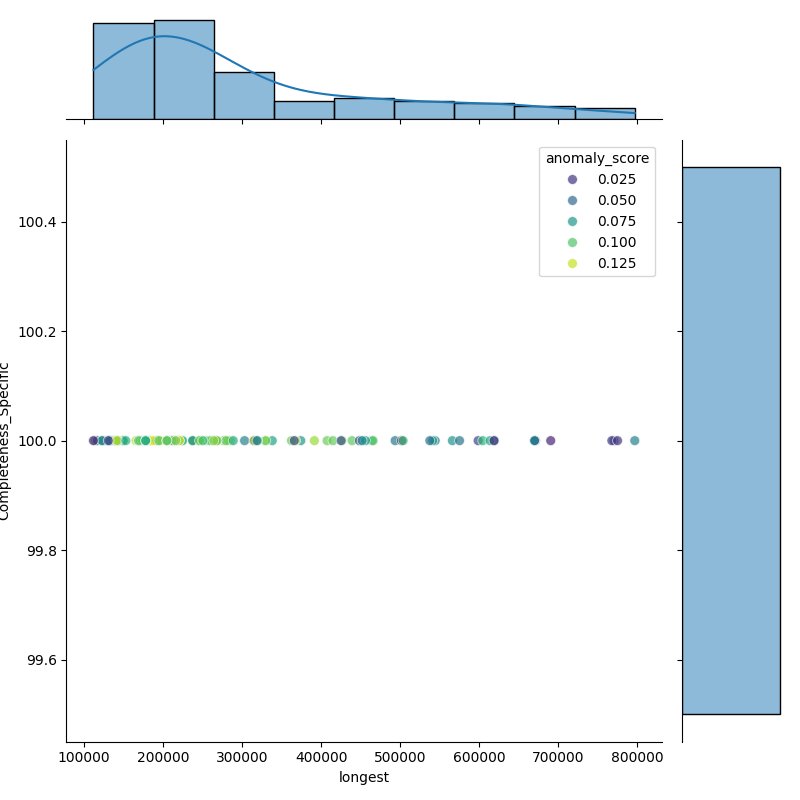
These plots show genomes before and after filtering to highlight the outliers removed. Left: Heatmap of all genomes in the dataset. Middle: A representative sample of genomes, with anomalies highlighted (purple). Right: The filtered distribution after applying filtering. There may have been additional adjustments and rounding so the distribution here may not enirely match with the final suggested metrics.