Bacillus cereus is a facultatively anaerobic, endospore-forming Gram-positive rod in the family Bacillaceae, ubiquitous in soil, dust, and a wide range of foods. It is a well-established cause of foodborne illness, producing emetic (cereulide) and diarrhoeal (Hbl, Nhe) toxins, and can also cause serious non-gastrointestinal infections such as endophthalmitis, meningitis, and bacteraemia, particularly in neonates and immunocompromised patients. B. cereus is the type species of the B. cereus sensu lato group, a complex of closely related species with highly conserved chromosomes but variable plasmid content that drives differences in pathogenic potential.
For detailed methods on how these thresholds were calculated, please see Methods. The suggested thresholds are in the table below. These thresholds are based on 158 genomes from RefSeq and 307 genomes from other sources. These thresholds were applied to all the bacteria dataset, which resulted in removing 20 and retaining 445. The list of genomes retained (i.e. high quality) and the list of genomes rejected (filtered) can be downloaded below. These files are in .xz format. The rejected genomes file also includes the reason why.
These tables provide a summary of the distribution of each metric, including SDeviation, Mean, Median, and Percentiles.
These thresholds were applied to all the bacteria dataset. The list of genomes retained (i.e. high quality) and the list of genomes rejected (filtered) can be downloaded below. These files are in .xz format. The rejected genomes file also includes the reason why.
| Metric | Lower bound | Upper bound |
|---|---|---|
| N50 | 10,000 | - |
| no_of_contigs | - | 1,140 |
| GC_Content | 34.00 | 36.00 |
| Completeness | 95.00 | - |
| Contamination | - | 6.000 |
| Total_Coding_Sequences | 5,000 | 7,100 |
| Genome_Size | 4,900,000 | 6,800,000 |
This plot shows the relationship between the number of coding sequences (CDS) and genome size. It helps to visualize how genome size correlates with the number of genes. This should be linear – as genome size increases, the number of coding sequences should also increase. Any secondary trend lines or non-linear behaviour indicates bona fide separate populations within the retained genomes or some remaining contaminant.
Histogram comparing SRA to RefSeq; each bar shows genome density across value ranges to highlight shifts, peaks, or outliers.
QQ (quantile-quantile) plot comparing SRA and RefSeq. Points along the diagonal follow the expected distribution; deviations indicate skew, outliers, or other systematic differences.
A table of complete RefSeq genomes for Bacillus cereus used to calibrate this scheme. The file includes accessions, some sample information, genome size, GC content, and other key metrics.
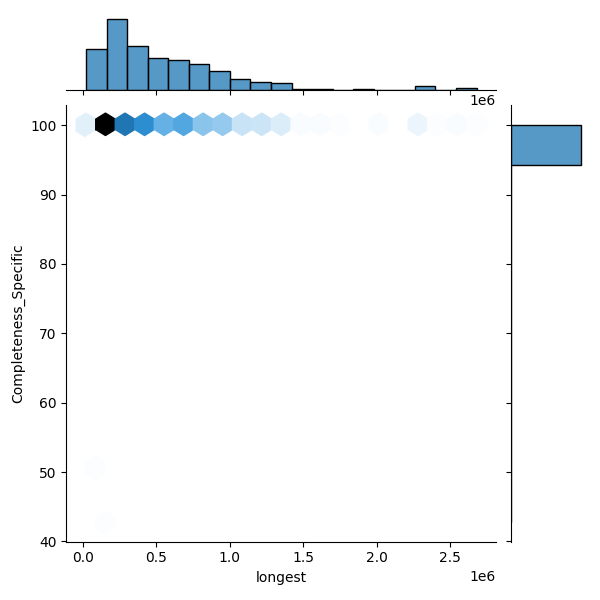
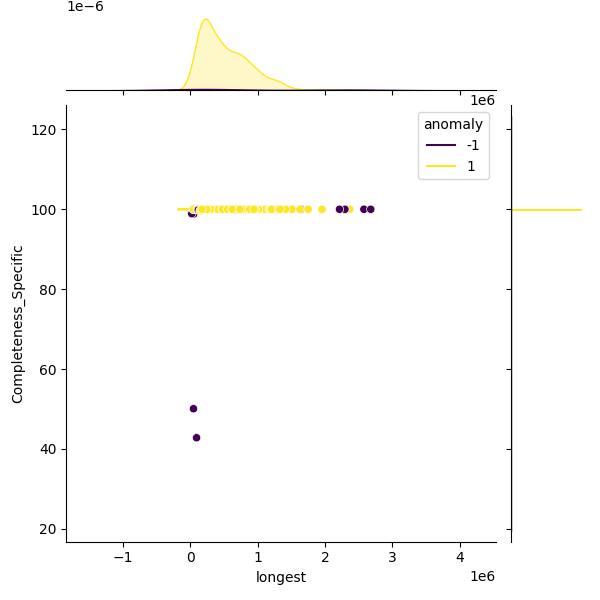
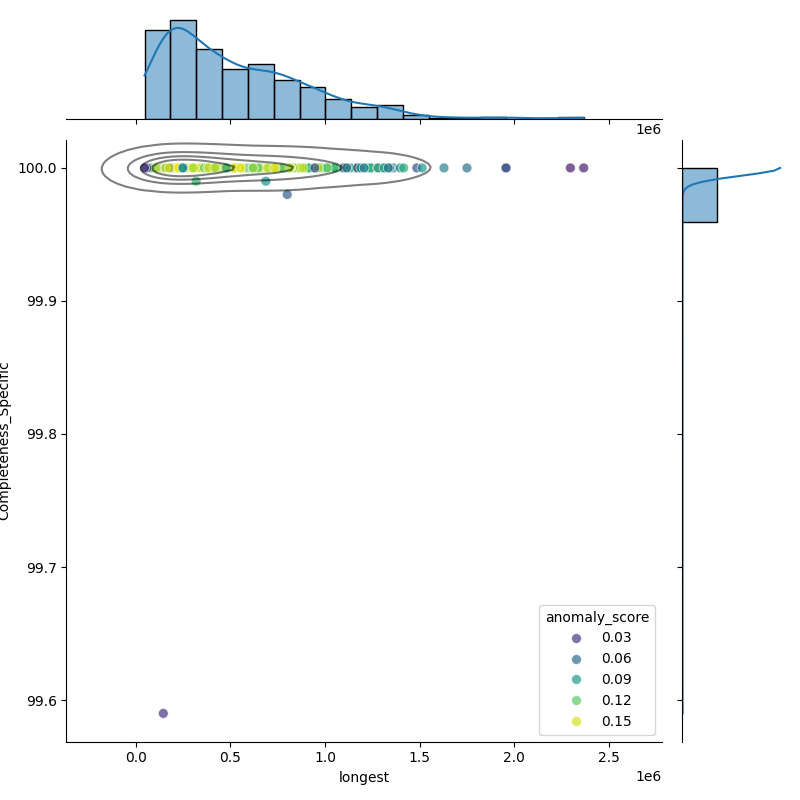
These plots show genomes before and after filtering to highlight the outliers removed. Left: Heatmap of all genomes in the dataset. Middle: A representative sample of genomes, with anomalies highlighted (purple). Right: The filtered distribution after applying filtering. There may have been additional adjustments and rounding so the distribution here may not enirely match with the final suggested metrics.