Aliivibrio fischeri (formerly Vibrio fischeri) is a facultatively anaerobic, bioluminescent Gram-negative rod in the family Vibrionaceae, found as a free-living organism in temperate and subtropical marine waters. It is best known for its mutualistic symbiosis with the Hawaiian bobtail squid Euprymna scolopes, where it colonises the light organ and produces bioluminescence via the lux operon regulated by acyl-homoserine lactone quorum sensing. A. fischeri has served as a foundational model for studying quorum sensing, symbiosis, and bioluminescence, and its genome includes two chromosomes typical of the Vibrionaceae.
For detailed methods on how these thresholds were calculated, please see Methods. The suggested thresholds are in the table below. These thresholds are based on 2 genomes from RefSeq and 196 genomes from other sources. These thresholds were applied to all the bacteria dataset, which resulted in removing 7 and retaining 191. The list of genomes retained (i.e. high quality) and the list of genomes rejected (filtered) can be downloaded below. These files are in .xz format. The rejected genomes file also includes the reason why.
These tables provide a summary of the distribution of each metric, including SDeviation, Mean, Median, and Percentiles.
These thresholds were applied to all the bacteria dataset. The list of genomes retained (i.e. high quality) and the list of genomes rejected (filtered) can be downloaded below. These files are in .xz format. The rejected genomes file also includes the reason why.
| Metric | Lower bound | Upper bound |
|---|---|---|
| N50 | 8,000 | - |
| no_of_contigs | - | 800.0 |
| GC_Content | 38.00 | 39.00 |
| Completeness | 93.00 | - |
| Contamination | - | 12.00 |
| Total_Coding_Sequences | 3,600 | 4,400 |
| Genome_Size | 4,000,000 | 4,600,000 |
This plot shows the relationship between the number of coding sequences (CDS) and genome size. It helps to visualize how genome size correlates with the number of genes. This should be linear – as genome size increases, the number of coding sequences should also increase. Any secondary trend lines or non-linear behaviour indicates bona fide separate populations within the retained genomes or some remaining contaminant.
Histogram comparing SRA to RefSeq; each bar shows genome density across value ranges to highlight shifts, peaks, or outliers.
QQ (quantile-quantile) plot comparing SRA and RefSeq. Points along the diagonal follow the expected distribution; deviations indicate skew, outliers, or other systematic differences.
A table of complete RefSeq genomes for Aliivibrio fischeri used to calibrate this scheme. The file includes accessions, some sample information, genome size, GC content, and other key metrics.
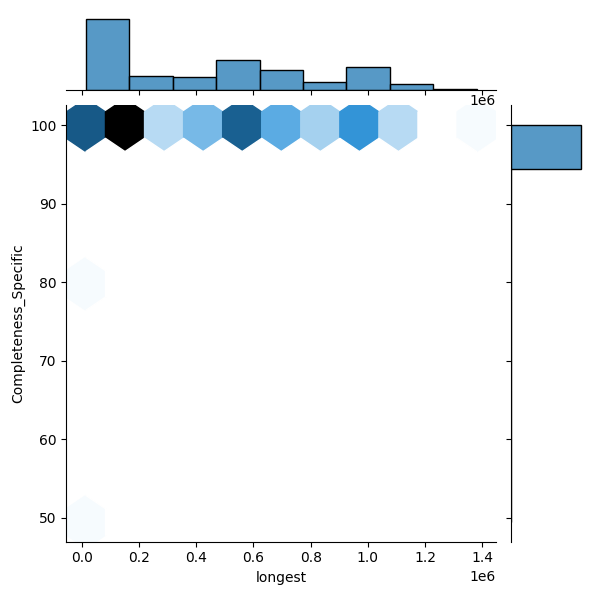
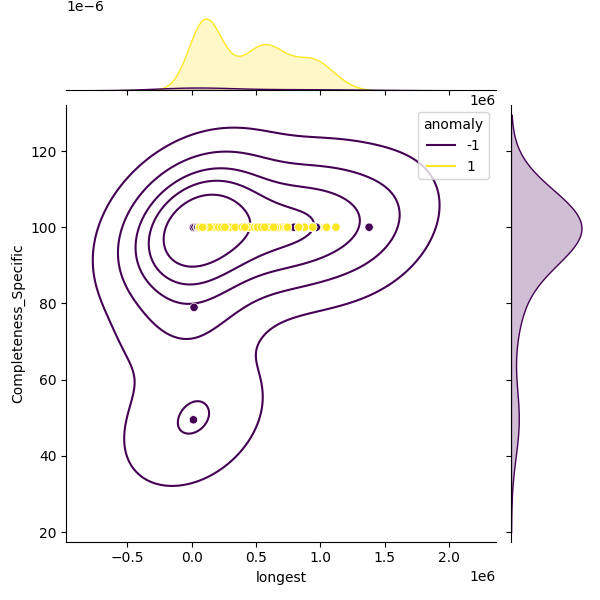
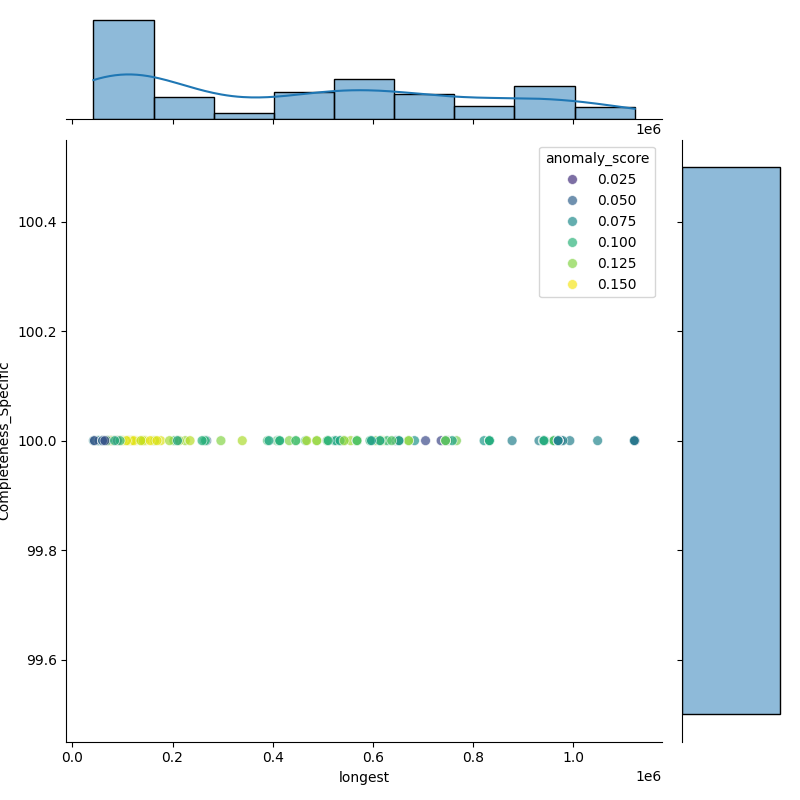
These plots show genomes before and after filtering to highlight the outliers removed. Left: Heatmap of all genomes in the dataset. Middle: A representative sample of genomes, with anomalies highlighted (purple). Right: The filtered distribution after applying filtering. There may have been additional adjustments and rounding so the distribution here may not enirely match with the final suggested metrics.