Aeromonas caviae is a facultatively anaerobic, oxidase-positive Gram-negative rod in the family Aeromonadaceae, commonly found in freshwater, sewage, and food products. It is one of the most frequently isolated Aeromonas species from human gastrointestinal infections, particularly causing self-limiting diarrhoea in children, and can occasionally produce wound infections and bacteraemia. A. caviae typically carries a chromosomal metallo-beta-lactamase gene and possesses a diverse set of virulence factors, though it generally lacks the aerolysin toxin found in other pathogenic aeromonads.
For detailed methods on how these thresholds were calculated, please see Methods. The suggested thresholds are in the table below. These thresholds are based on 53 genomes from RefSeq and 777 genomes from other sources. These thresholds were applied to all the bacteria dataset, which resulted in removing 35 and retaining 795. The list of genomes retained (i.e. high quality) and the list of genomes rejected (filtered) can be downloaded below. These files are in .xz format. The rejected genomes file also includes the reason why.
These tables provide a summary of the distribution of each metric, including SDeviation, Mean, Median, and Percentiles.
These thresholds were applied to all the bacteria dataset. The list of genomes retained (i.e. high quality) and the list of genomes rejected (filtered) can be downloaded below. These files are in .xz format. The rejected genomes file also includes the reason why.
| Metric | Lower bound | Upper bound |
|---|---|---|
| N50 | 23,000 | - |
| no_of_contigs | - | 670.0 |
| GC_Content | 60.00 | 63.00 |
| Completeness | 98.00 | - |
| Contamination | - | 6.000 |
| Total_Coding_Sequences | 3,800 | 5,200 |
| Genome_Size | 4,200,000 | 5,400,000 |
This plot shows the relationship between the number of coding sequences (CDS) and genome size. It helps to visualize how genome size correlates with the number of genes. This should be linear – as genome size increases, the number of coding sequences should also increase. Any secondary trend lines or non-linear behaviour indicates bona fide separate populations within the retained genomes or some remaining contaminant.
Histogram comparing SRA to RefSeq; each bar shows genome density across value ranges to highlight shifts, peaks, or outliers.
QQ (quantile-quantile) plot comparing SRA and RefSeq. Points along the diagonal follow the expected distribution; deviations indicate skew, outliers, or other systematic differences.
A table of complete RefSeq genomes for Aeromonas caviae used to calibrate this scheme. The file includes accessions, some sample information, genome size, GC content, and other key metrics.
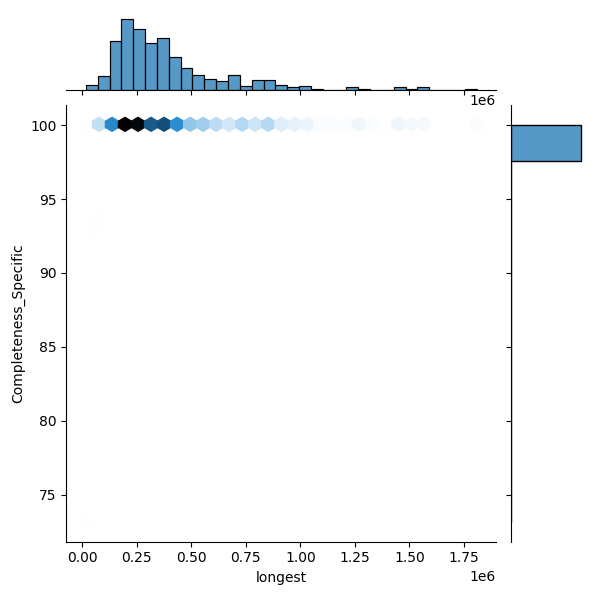
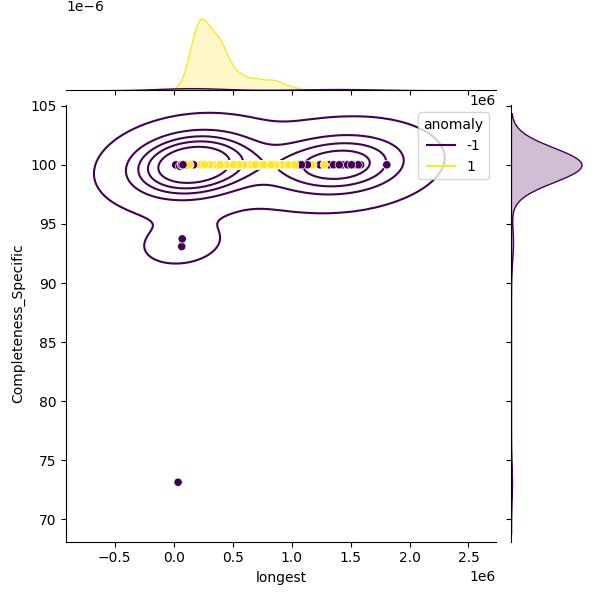
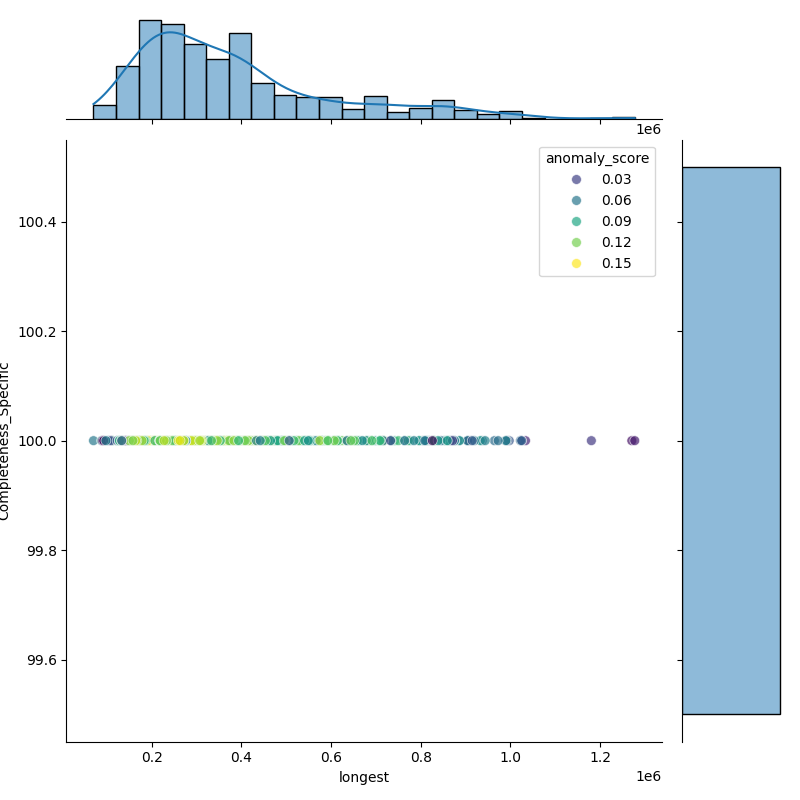
These plots show genomes before and after filtering to highlight the outliers removed. Left: Heatmap of all genomes in the dataset. Middle: A representative sample of genomes, with anomalies highlighted (purple). Right: The filtered distribution after applying filtering. There may have been additional adjustments and rounding so the distribution here may not enirely match with the final suggested metrics.