The engine flagged the reference dataset for this species — review the signals below before relying on these thresholds.
Derived from 415 genomes: 28 from RefSeq and 387 from other sources. For the derivation pipeline and the PASS / WARN / FAIL verdict model, see the methods page for qualibact-v1.1.
QualiBact qualibact-v1.1 thresholds for Achromobacter xylosoxidans, derived from an expanded reference set that brings in additional A. xylosoxidans genomes beyond the AllTheBacteria-2024-08 distribution used for v1.0.
Threshold derivation, outlier detection, and PASS / WARN / FAIL verdict logic are unchanged from v1.0. See the methods page for qualibact-v1.1 for the engine pipeline and what differs between v1.0 and v1.1 overall.
Threshold values and rationale for Achromobacter xylosoxidans (qualibact-v1.1) contributed by:
This table summarises the distribution of each metric, including standard deviation, mean, median, and percentiles.
A combined summary table across all species is available on the summary page.
| Metric | Distribution | n | Mean | SD | Min | Q1 | Median | Q3 | Max |
|---|---|---|---|---|---|---|---|---|---|
| N50 | non-normal | 387 | 323,578 | 320,676 | 23,877 | 67,362 | 151,927 | 503,574 | 1,404,701 |
| no_of_contigs | non-normal | 387 | 100.96 | 85.56 | 13 | 31 | 78 | 150 | 464 |
| longest | non-normal | 387 | 776,029 | 646,153 | 84,619 | 245,602 | 478,331 | 1,222,825 | 2,918,498 |
| GC_Content | non-normal | 387 | 67.82 | 0.38 | 67 | 68 | 68 | 68 | 68 |
| Completeness_Specific | non-normal | 387 | 99.97 | 0.19 | 98.04 | 100 | 100 | 100 | 100 |
| Contamination | non-normal | 387 | 0.3 | 0.35 | 0 | 0.07 | 0.19 | 0.37 | 1.83 |
| Total_Coding_Sequences | non-normal | 387 | 5,897 | 243.69 | 5,306 | 5,709 | 5,860 | 6,068 | 6,633 |
| Genome_Size | non-normal | 387 | 6,456,924 | 233,650 | 5,869,362 | 6,294,921 | 6,431,808 | 6,603,166 | 7,048,698 |
Full statistics including KS test vs RefSeq and Wasserstein distance are in the downloadable summary.csv.
Derived from 415 genomes including 28 RefSeq references
Both Fail and Warn bands shown as the published rounded values — easier to cite and consistent across the species page, CSV downloads, and downstream QC tools.
| Metric | Fail below | Warn below | Warn above | Fail above |
|---|---|---|---|---|
| Genome_Size | 5,900,000 | 6,000,000 | 7,000,000 | 7,400,000 |
| GC_Content | 65 | 67 | 68 | 69 |
| Total_Coding_Sequences | 5,300 | 5,400 | 6,400 | 6,900 |
| Completeness_Specific | 91 | 99 | - | - |
| Contamination | - | - | 2 | 10 |
| N50 | 24,000 | 33,000 | - | - |
| no_of_contigs | - | - | 320 | 430 |
| longest | - | - | - | - |
How to read this: a value between the two warn columns is typical for this species and passes QC. A value between a warn column and the corresponding fail column is borderline — worth a manual look but not an outright failure. A value outside the fail columns is unusual enough to fail QC.
Histogram comparing SRA to RefSeq; each bar shows genome density across value ranges to highlight shifts, peaks, or outliers.
QQ (quantile-quantile) plot comparing SRA and RefSeq. Points along the diagonal follow the expected distribution; deviations indicate skew, outliers, or other systematic differences.
A table of complete RefSeq genomes for Achromobacter xylosoxidans used to calibrate this scheme. The file includes accessions, some sample information, genome size, GC content, and other key metrics.
Per-assembly inputs the engine used to derive the Achromobacter xylosoxidans reference distribution for this scheme: sample, sylph species call, N50, contig count, longest contig, total length, completeness, contamination, total coding sequences, genome size, GC content. Gzipped CSV.
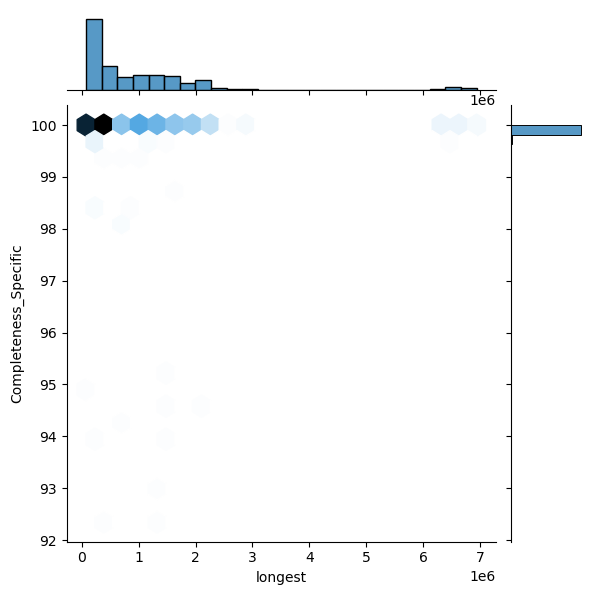
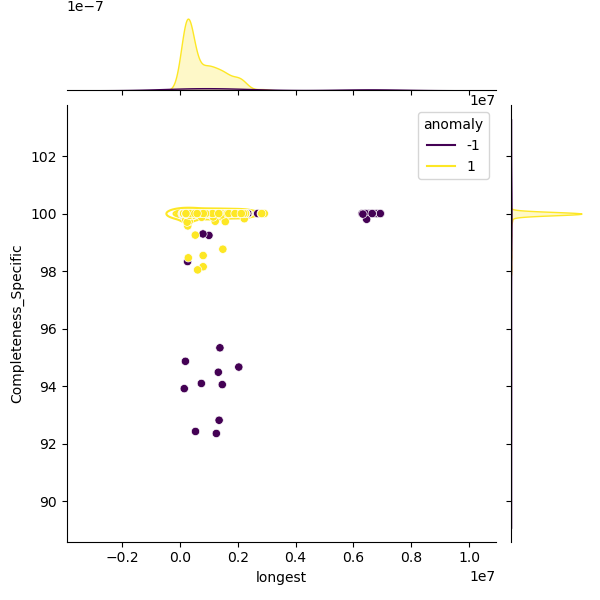
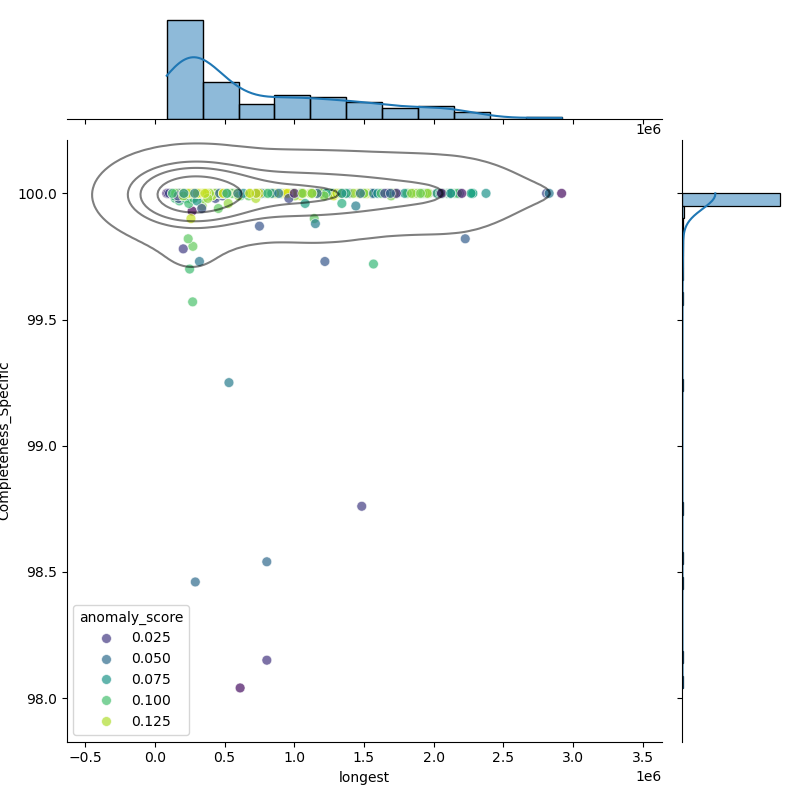
These plots show genomes before and after filtering to highlight the outliers removed:
The filtered distribution shown here may not exactly match the published thresholds because additional rounding and curator adjustments are applied on top.